Fig. 2.
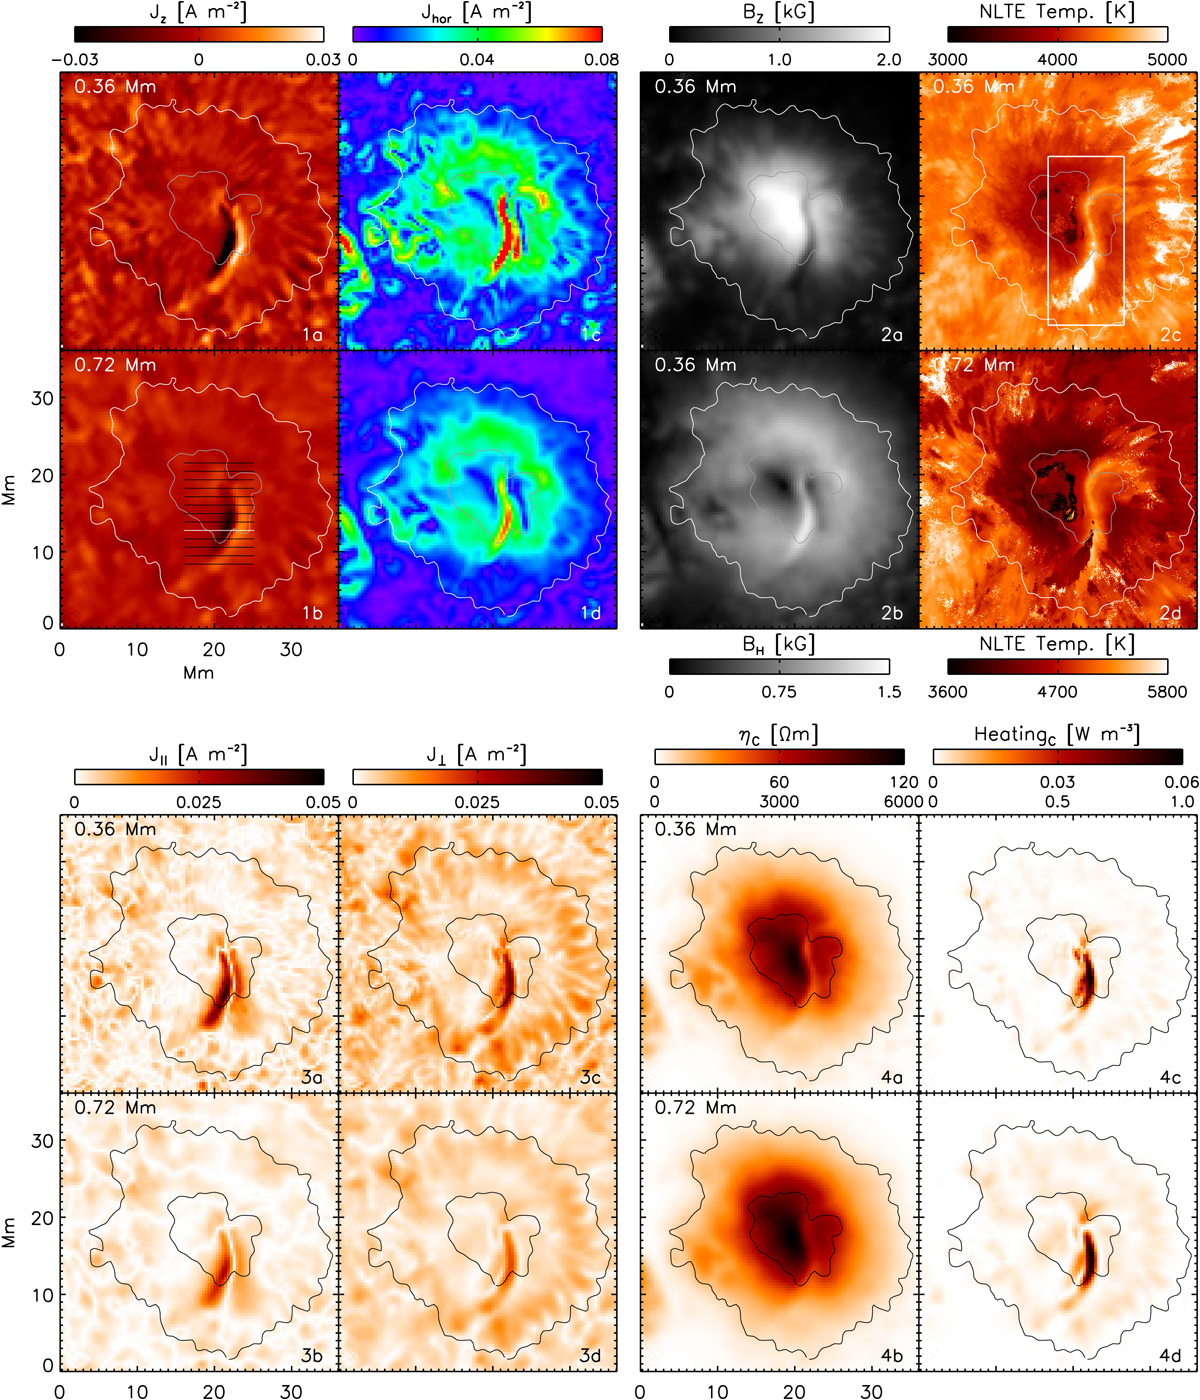
Electric currents, temperature enhancements, and Joule heating in the sunspot LB. Panels 1a–1d: spatial distribution of the vertical current density Jz and horizontal current density Jhor at z = 0.36 Mm (top) and z = 0.72 Mm (bottom). The horizontal lines in panel 1b indicate the locations of the 2D cuts shown in Fig. 4. The white horizontal line marks cut No. 5 used in Figs. 4g and h. Panels 2a–2b: spatial distribution of the vertical (top) and horizontal (bottom) component of the magnetic field at z = 0.36 Mm. Panels 2c–2d: spatial distribution of the NLTE temperature at z = 0.36 Mm (top) and z = 0.72 Mm (bottom). The white rectangle in panel 2c is a smaller FOV centered on the LB shown in Fig. 3. Panels 3a–3d and 4a–4d: spatial distribution of J||, J⊥, Cowling resistivity ηC, and its associated Joule heating. The color bar in panels 4 comprises two scales, where the top and bottom numbers correspond to 0.36 Mm and 0.72 Mm, respectively.
Current usage metrics show cumulative count of Article Views (full-text article views including HTML views, PDF and ePub downloads, according to the available data) and Abstracts Views on Vision4Press platform.
Data correspond to usage on the plateform after 2015. The current usage metrics is available 48-96 hours after online publication and is updated daily on week days.
Initial download of the metrics may take a while.