Fig. 1.
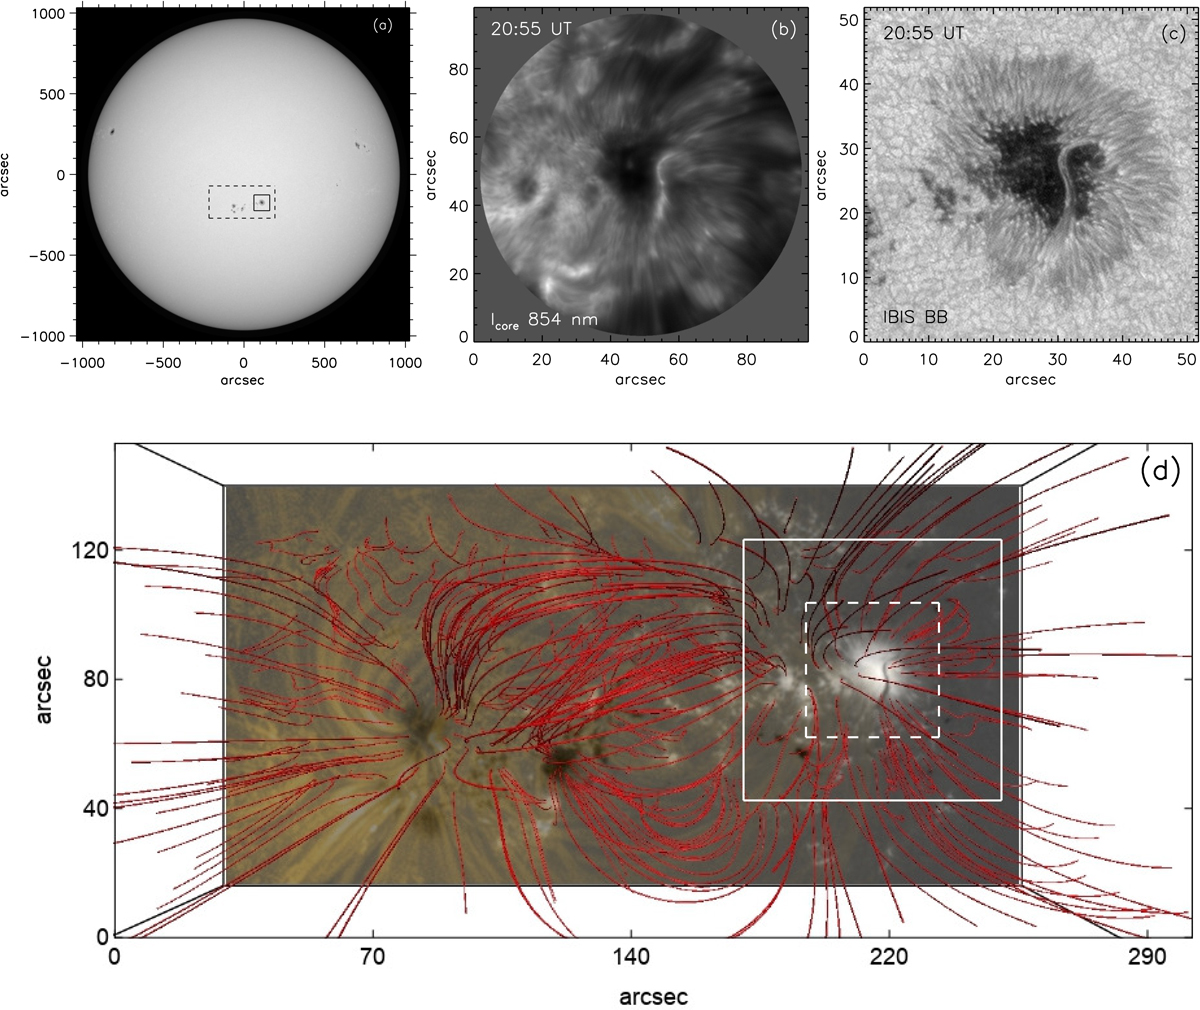
HMI and IBIS observations of the leading sunspot in NOAA AR 12002. Top: full-disk HMI continuum image (left) at 21:00 UT on 2014 March 13, IBIS Ca II IR line-core image (middle), and speckle-reconstructed IBIS broadband image (right). The square and dashed rectangle in panel a indicate the IBIS and HMI SHARP FOV, respectively. Bottom: field lines derived from the NFFF extrapolation overlaid on a composite image of the vertical component of the magnetic field and the AIA 171 Å image for the SHARP FOV. The solid and dashed white squares correspond to the IBIS FOV and the smaller FOV shown in Fig. 2, respectively.
Current usage metrics show cumulative count of Article Views (full-text article views including HTML views, PDF and ePub downloads, according to the available data) and Abstracts Views on Vision4Press platform.
Data correspond to usage on the plateform after 2015. The current usage metrics is available 48-96 hours after online publication and is updated daily on week days.
Initial download of the metrics may take a while.