Fig. 2
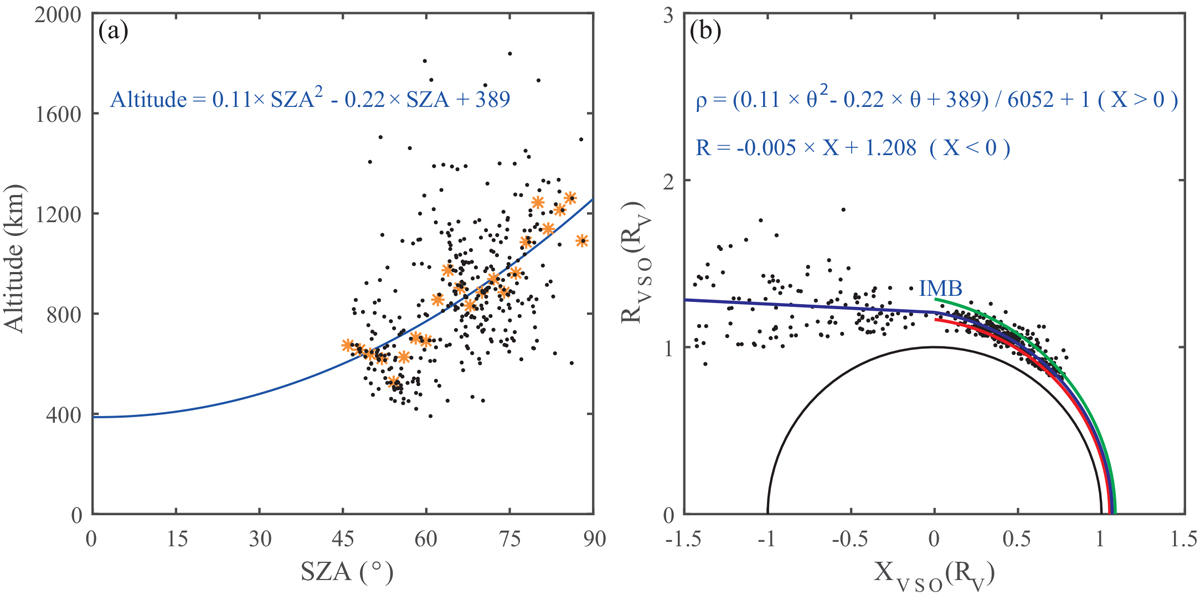
Average position of the Venusian IMB at solar maximum. (a) The altitude of the dayside IMB (marked by black dots) as a function of SZA. The orange asterisks are the median value of these altitudes. The blue curve is the fitted altitude based on the median altitudes. (b) The IMB crossings (black dots), the fitted IMB location (blue line), the IMB location at solar minimum from Zhang et al. (2008a) (red line), and the IMB location at solar maximum from Zhang et al. (1991) (green line). The nightside IMB distance RVSO is fitted as a function of XVSO.
Current usage metrics show cumulative count of Article Views (full-text article views including HTML views, PDF and ePub downloads, according to the available data) and Abstracts Views on Vision4Press platform.
Data correspond to usage on the plateform after 2015. The current usage metrics is available 48-96 hours after online publication and is updated daily on week days.
Initial download of the metrics may take a while.