Fig. 3.
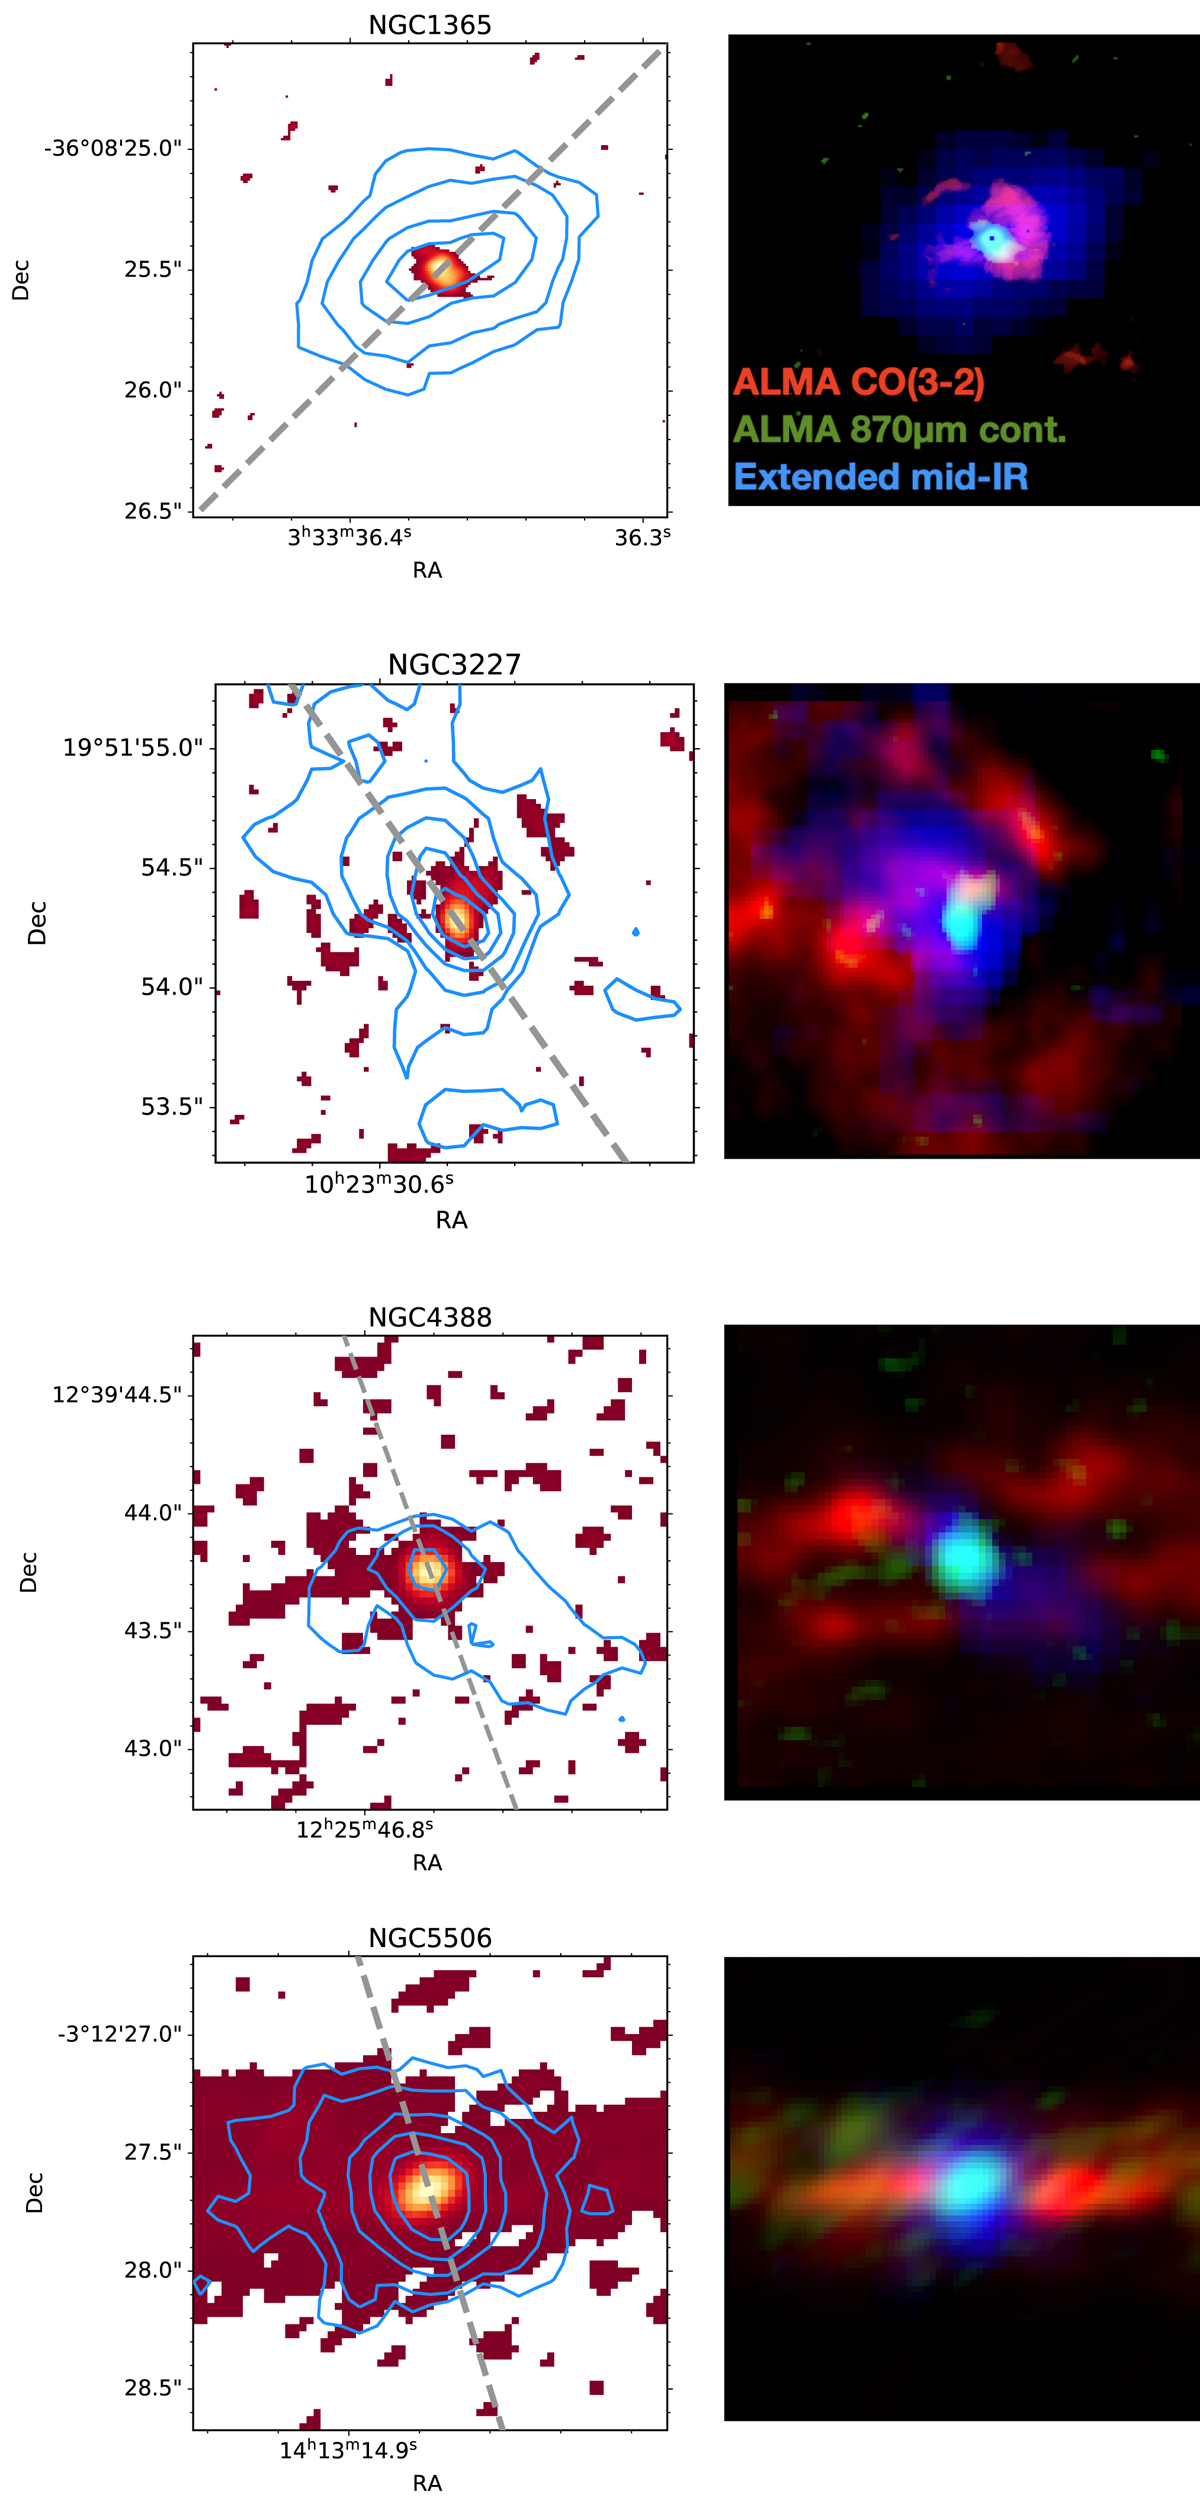
Galaxies with extended mid-IR emission. Left panels: in color are the ALMA MSR 870 μm continuum images (with both the unresolved and the extended emission) from GB21. The blue contours are the mid-IR PSF-subtracted images with the same levels as in Fig. 2. The FoV is 2″ × 2″. We also plot with the dashed lines the approximate PA of the ionization cones, NLR and/or outflows (see Sect. 3.4). Right panels: RGB images constructed with the ALMA CO(3−2) image (red), ALMA 870 μm continuum (green), and extended mid-IR emission (blue). The FoV is approximately the same as in the left panels.
Current usage metrics show cumulative count of Article Views (full-text article views including HTML views, PDF and ePub downloads, according to the available data) and Abstracts Views on Vision4Press platform.
Data correspond to usage on the plateform after 2015. The current usage metrics is available 48-96 hours after online publication and is updated daily on week days.
Initial download of the metrics may take a while.