Fig. 2.
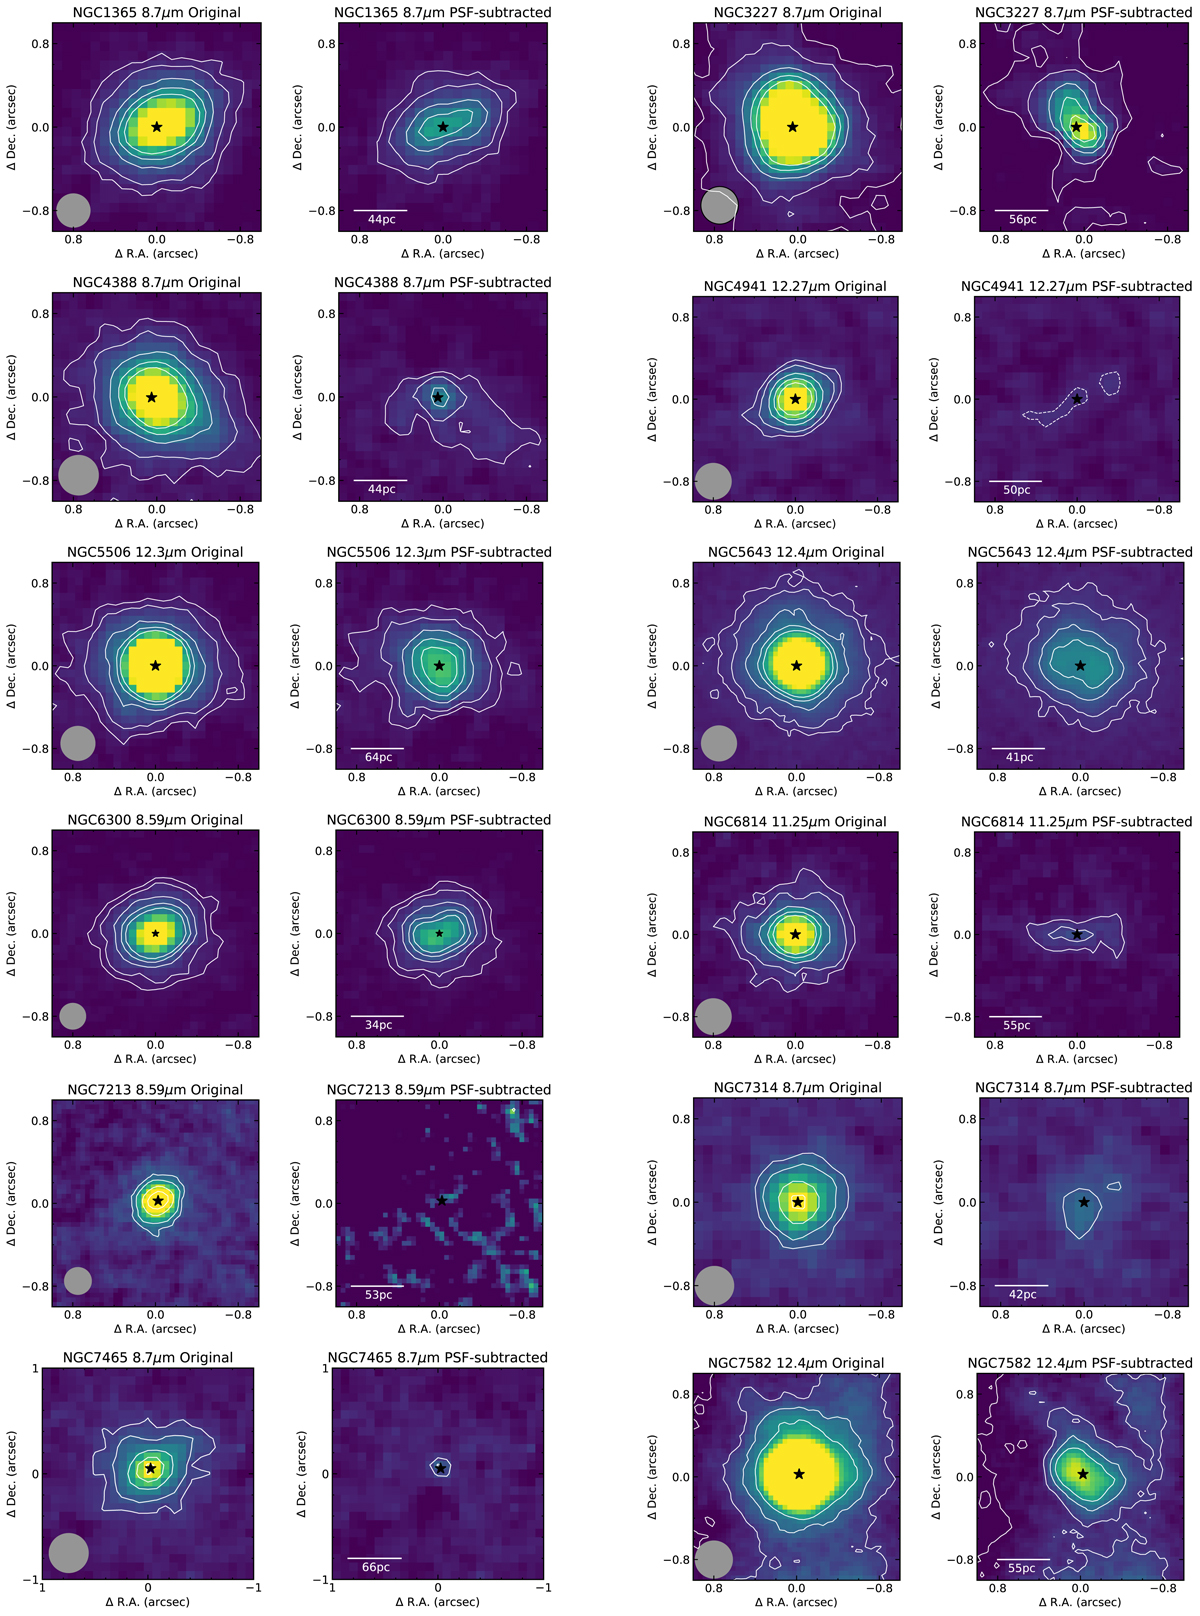
Mid-IR images of the central 2″ × 2″. For each galaxy, the left and right panels are the original and the PSF-subtracted images, respectively. The gray circles indicate the FWHM of the standard star as fit with a 2D Gaussian. The star symbol marks the peak of the mid-IR emission before PSF subtraction. The first contour with a solid line is at a 3 × σbk level and the next contours are at 5, 10, 15, 20 × σbk levels. For NGC 4941 the dashed lines in the PSF-subtracted image are 2 × σbk. All the images are oriented north up, east to the left. We smoothed the original and PSF-subtracted images with a Gaussian function (see text for more details). For each galaxy we display the two images with the same intensity and contour levels.
Current usage metrics show cumulative count of Article Views (full-text article views including HTML views, PDF and ePub downloads, according to the available data) and Abstracts Views on Vision4Press platform.
Data correspond to usage on the plateform after 2015. The current usage metrics is available 48-96 hours after online publication and is updated daily on week days.
Initial download of the metrics may take a while.