Fig. 1.
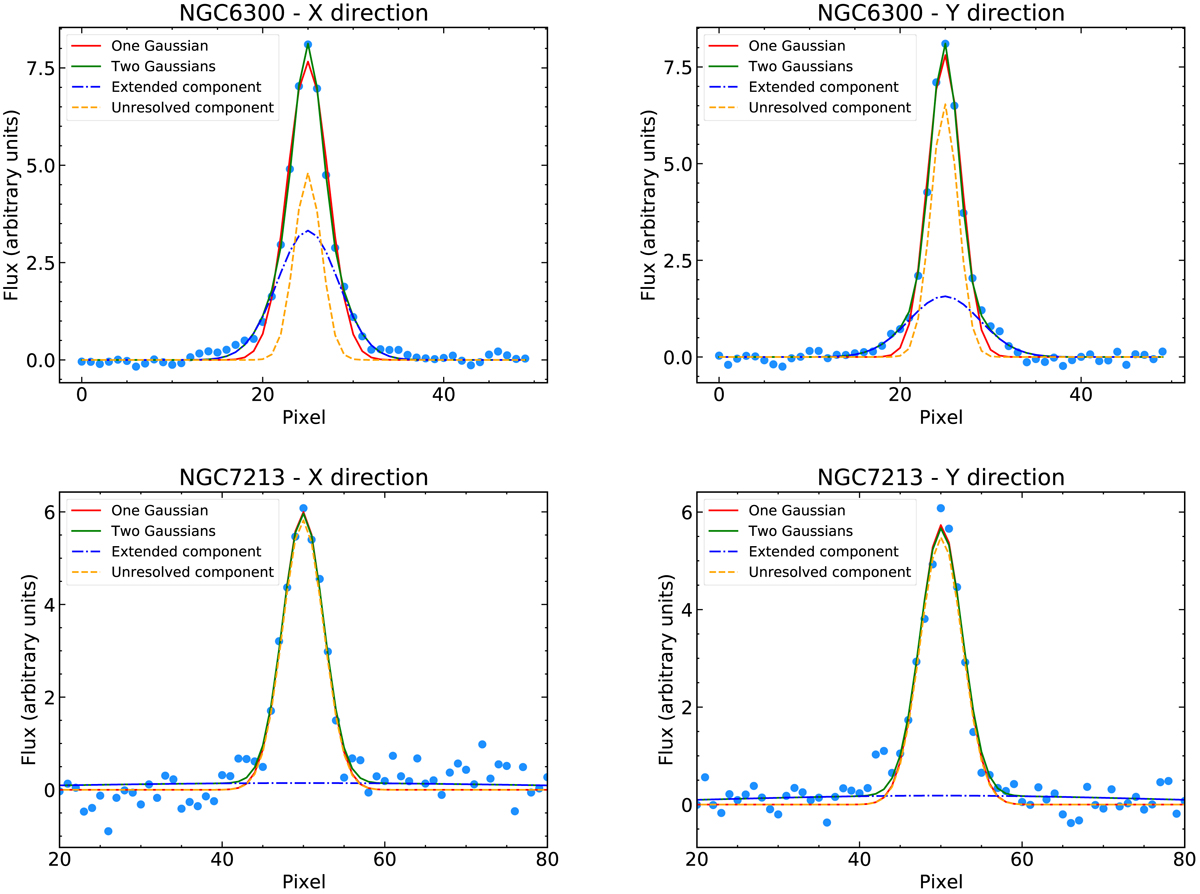
Examples of the fits of the 1D mid-IR profiles extracted along the X and Y directions for two galaxies in our sample. The top panels are for NGC 6300, which is a case with a large fraction of extended mid-IR emission, whereas the bottom panels are for NGC 7213, which appears unresolved at the angular resolution of the mid-IR observations. The cyan dots are the observations and the red lines are the result of fitting the galaxy profile with just one Gaussian function. The green lines are the result of fitting the galaxy profile with the sum of two Gaussian functions, one to represent the unresolved component (orange dashed lines) and the second the extended emission (blue dotted-dashed lines).
Current usage metrics show cumulative count of Article Views (full-text article views including HTML views, PDF and ePub downloads, according to the available data) and Abstracts Views on Vision4Press platform.
Data correspond to usage on the plateform after 2015. The current usage metrics is available 48-96 hours after online publication and is updated daily on week days.
Initial download of the metrics may take a while.