Fig. 7.
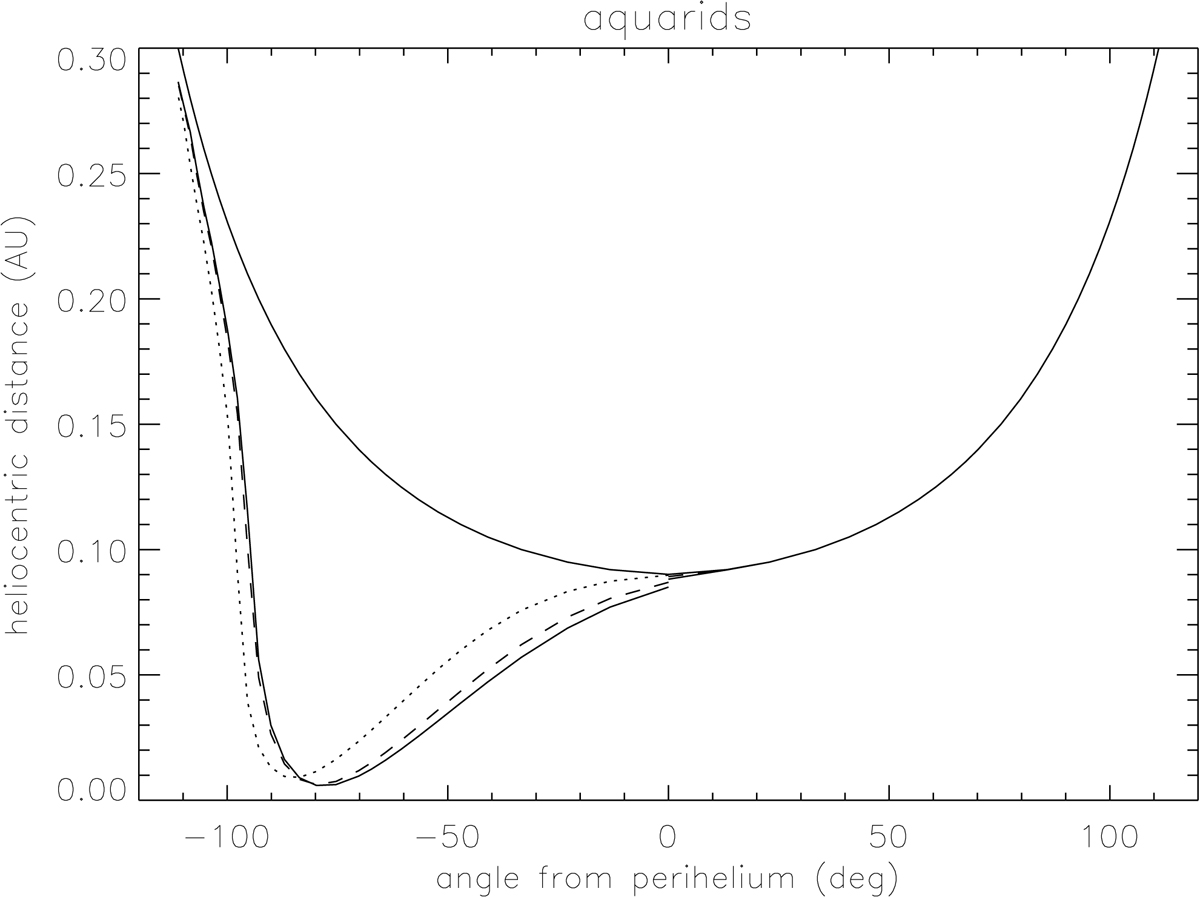
Effect of corotation on the propagation of nanodust particles emitted from the orbit of the Aquarids. The distances of the closest approach to the Sun are plotted against the position of the emission point on the orbit, represented by the angle counted from perihelion. The corotation models are the same as in Fig. 6: no corotation (solid line), maximum corotation (dotted line), and the model of Weber and Davis (dashed line).
Current usage metrics show cumulative count of Article Views (full-text article views including HTML views, PDF and ePub downloads, according to the available data) and Abstracts Views on Vision4Press platform.
Data correspond to usage on the plateform after 2015. The current usage metrics is available 48-96 hours after online publication and is updated daily on week days.
Initial download of the metrics may take a while.