Fig. 6.
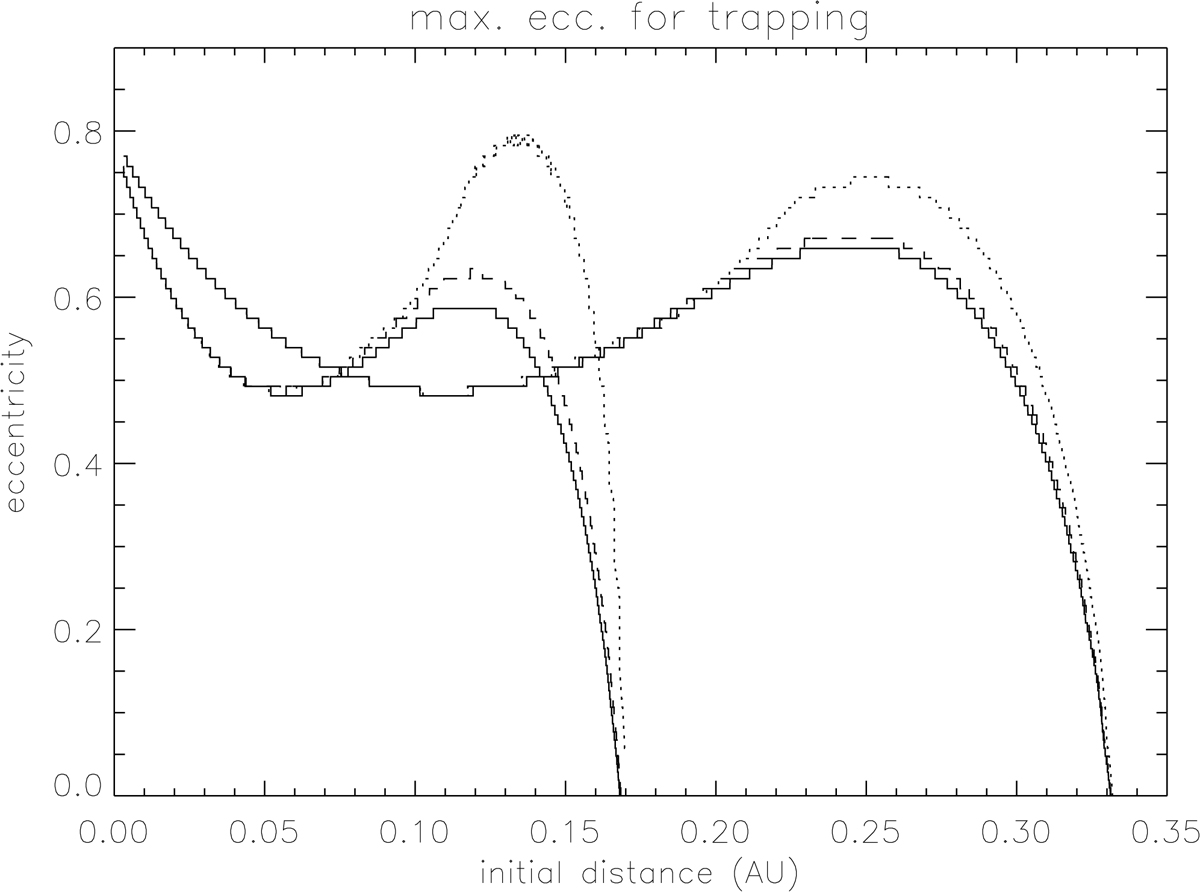
Maximum eccentricity of the parent body orbit consistent with trapping of the emitted nanodust. The nanodust particle is emitted at perihelium. The cases illustrated are no corotation (solid line), maximum corotation (dotted line), and the model of Weber and Davis (dashed line). The curves correspond to particles emitted at the points of maximum heliolatitude from the orbits of 20° inclination (curves on the left) and of 70° inclination (curves on the right).
Current usage metrics show cumulative count of Article Views (full-text article views including HTML views, PDF and ePub downloads, according to the available data) and Abstracts Views on Vision4Press platform.
Data correspond to usage on the plateform after 2015. The current usage metrics is available 48-96 hours after online publication and is updated daily on week days.
Initial download of the metrics may take a while.