Fig. 4.
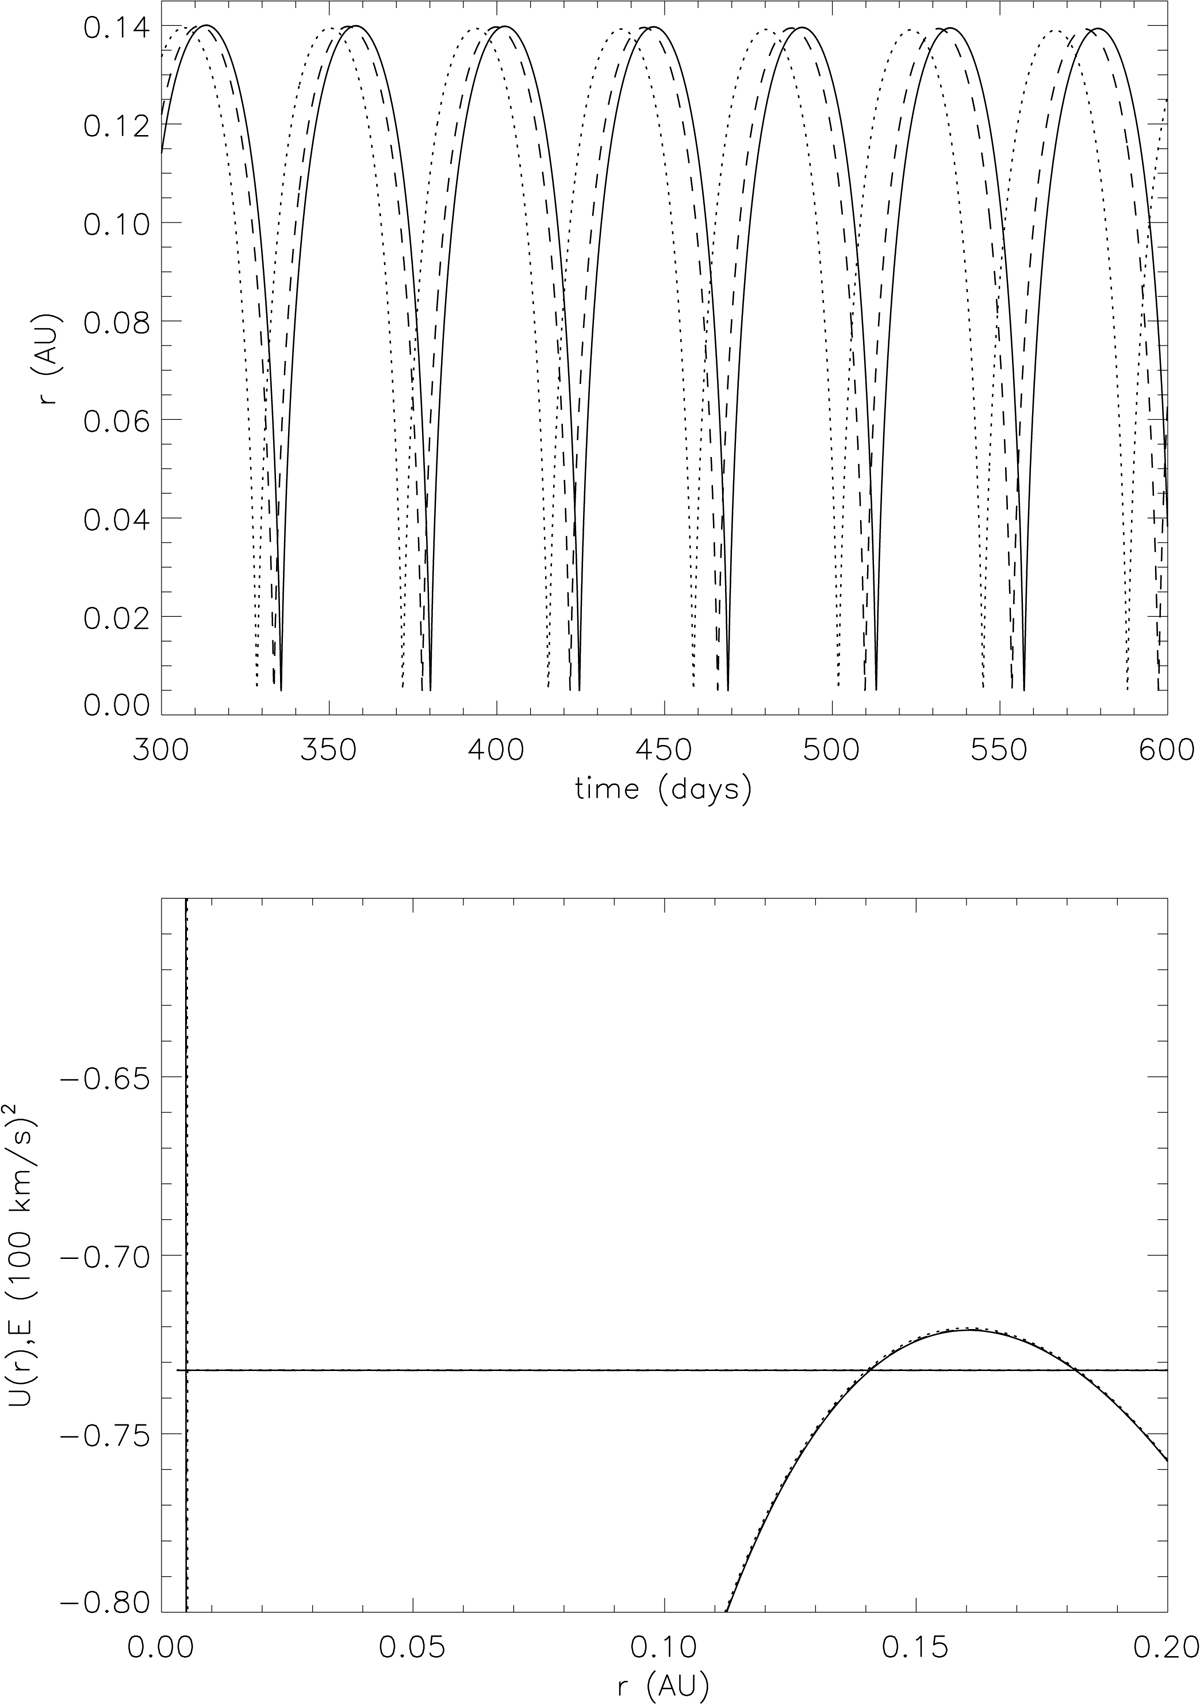
As Fig. 3, but for the case of a particle emitted at 0.14 AU, close to the outer limit of the trapping region. The solutions for the different models are lying approximately on top of each other. Lower figure: was restricted in vertical range to show clearly the relative positions of the potential barrier and the energy levels. The minimum value of the potential U occurs at U(r)≈ − 4.3 in our (100 km s−1)2 units.
Current usage metrics show cumulative count of Article Views (full-text article views including HTML views, PDF and ePub downloads, according to the available data) and Abstracts Views on Vision4Press platform.
Data correspond to usage on the plateform after 2015. The current usage metrics is available 48-96 hours after online publication and is updated daily on week days.
Initial download of the metrics may take a while.