| Issue |
A&A
Volume 652, August 2021
|
|
|---|---|---|
| Article Number | A6 | |
| Number of page(s) | 9 | |
| Section | Catalogs and data | |
| DOI | https://doi.org/10.1051/0004-6361/202141003 | |
| Published online | 30 July 2021 | |
Twelve-year update of the MST catalogue of γ-ray source candidates above 10 GeV and at Galactic latitudes higher than 20°⋆
1
INAF/OAS, Via Piero Gobetti 101, 40129 Bologna, Italy
e-mail: riccardo.campana@inaf.it
2
INAF/IAPS, Via Fosso del Cavaliere 100, 00133 Roma, Italy
Received:
6
April
2021
Accepted:
11
May
2021
We present an updated version catalogue of γ-ray source candidates, 12Y-MST, selected using the minimum spanning tree (MST) algorithm on the 12-year Fermi-LAT sky (Pass 8) at energies higher than 10 GeV. The high-energy sky at absolute Galactic latitudes above 20° has been investigated using rather restrictive selection criteria, resulting in a total sample of 1664 photon clusters, or candidate sources. Of these, 230 are new detections, that is, candidate sources without any association in other γ-ray catalogues. A large fraction of them have interesting counterparts, most likely blazars. We describe the main results on the catalogue selection and search of counterparts. We also present an additional sample of 224 candidate sources (12Y-MSTw), which are clusters that we extracted by applying weaker selection criteria: about 57% of them have not been reported in other catalogues.
Key words: gamma rays: general / gamma rays: galaxies / methods: data analysis
The catalogue is only available at the CDS via anonymous ftp to cdsarc.u-strasbg.fr (130.79.128.5) or via http://cdsarc.u-strasbg.fr/viz-bin/cat/J/A+A/652/A6
© ESO 2021
1. Introduction
In a previous paper (Campana et al. 2018a) we reported a complete catalogue of γ-ray source candidates at Galactic latitudes |b|> 20°, selected by means of the minimum spanning tree (MST) clustering algorithm, which was applied to extract significant photon spatial over-densities in Fermi-Large Area Telescope (LAT) mapping of the sky at energies higher than 10 GeV (Campana et al. 2008, 2013). In that work we examined the data accumulated on the full sky, over the nine-year time interval from 2008 August 4 to 2017 August 4, excluding a 40° wide belt around the Galactic Equator where the high-energy emission is strongly affected by many sources and extended structures. This 9Y-MST catalogue (hereafter 9Y) contains 1342 γ-ray candidate sources.
In several other papers, the MST cluster-finding algorithm was applied to identify several new blazar candidates (Bernieri et al. 2013; Campana et al. 2015, 2016a,b,c, 2017) and also to study the field of the Large Magellanic Cloud (LMC), allowing the first detection of high-energy emission from the supernova remnants N 49B and N 63A (Campana et al. 2018b). In general, it was shown that the advantage of MST is its capability of extracting ‘noise’ clusters from the background with even a low number of photons, and thus to discover rather faint high-energy sources.
In this paper we report an update of the 9Y-MST catalogue that is based on a longer observational run covering three additional years of data. Using essentially the same approach, we compiled a new catalogue of γ-ray sources and candidates (12Y-MST) that includes 322 more entries than 9Y for a total of 1664 clusters. Throughout this paper, the term ‘photon cluster’, or simply ‘cluster’, is used interchangeably to stand for γ-ray source or candidate source.
In Sect. 2 we summarise the main parameters we used for cluster selection. In Sect. 3 we describe the data reduction. The MST analysis and the general properties of the 12Y-MST catalogue are described in Sect. 5. We also present an additional catalogue of 224 candidate sources, obtained by applying less severe selection criteria (12Y-MSTw). This is useful to compare our method with other source-detection tools. The content and the characteristics of this sample are described in Sect. 6, and in Sects. 7 and 8 we summarise and discuss our results.
2. MST cluster detection and main parameters
The MST (see e.g., Cormen et al. 2009 and also Campana et al. 2008, 2013) is a topometric tool that can be used to search for spatial concentrations in a field of points. As previously stated, we have applied this method to the γ-ray sky, and detailed descriptions of the MST and of the selection criteria were presented elsewhere (e.g., in Campana et al. 2018a). We therefore describe here only the meaning and the relevance of the main parameters we used for the cluster selection that is reported in the catalogue.
The MST creates the unique tree that connects all the points in a two-dimensional metric space on the condition that the sum of the (weighted) distances {λi} of all pairs of connected points is minimum, provided that all distances are different. We considered the angular distances of the incoming direction of the photons. Clusters are obtained by eliminating all segments in the tree with a length λ > Λcut. This so-called separation value, suitably chosen, is defined in units of the mean edge length in the region in which the tree is computed Λm = (Σiλi)/N, with N equal to the total number of points. A set of disconnected sub-trees is thus obtained; then, an elimination process removes all the sub-trees with a number of nodes n ≤ Ncut, leaving only the clusters that have a size higher than a fixed threshold. The remaining set of sub-trees provides a first list of candidate clusters, and a secondary selection is applied to extract the most robust candidates as γ-ray sources. According to Campana et al. (2013), this procedure is based on some useful parameters, such as the clustering parameter,
with λm, k the mean distance of points in the kth cluster. Another quantity that is very useful for assessing the significance of the surviving clusters is the cluster magnitude,

where nk is the number of nodes in the cluster k. The probability of obtaining a given magnitude value combines that of selecting a cluster with nk nodes together with its ‘clumpiness’, compared to the mean separation in the field. It was found that  is a good estimator of statistical significance of MST clusters. In particular, a lower threshold value of M in the range 15–25 would reject the large majority of spurious (low-significance) clusters. For each cluster, the centroid coordinates are obtained by means of a weighted average of the photon coordinates. Additionally, the median radius Rm, k is defined as the radius of the circle centred at the centroid and containing nk/2 photons, and the maximum radius Rmax, k is equal to the angular distance between the centroid and the farthest photon in the cluster. For clusters associated with genuine point-like sources, Rm, k should be smaller than or comparable to the 68% containment radius of instrumental point spread function (PSF, see Ackermann et al. 2013), while the maximum radius gives information about the total extension of the cluster. For more details, see Campana et al. (2013) and the previous 9Y paper (Campana et al. 2018a).
3. Fermi-LAT dataset
The full Fermi-LAT dataset was downloaded in the form of weekly files from the FSSC archive1. It includes events above 10 GeV in the 12 years from 2008 August 4 to 2020 August 4 that were processed with the Pass 8, release 3 reconstruction algorithm and responses. The event lists were then filtered by applying the standard selection criteria on data quality and zenith angle (source class events, evclass = 128, front and back converting, evtype = 3, up to a maximum zenith angle of 90°). Events were then screened for standard good time interval selection.
For the sake of consistency with the previous analysis, the MST algorithm was applied to the data in the sky regions with |b|> 18° because clusters in the Galactic belt with a small number of photons are not stable, that is, their number of photons and other parameters change even for small variations in Λcut. The final dataset contains 324 133 photons, about 53% and 47% of which are in the north and south Galactic regions, respectively. This difference is mainly due to the nonuniform spatial distribution of the exposure, as already noted for the 9Y-MST catalogue. The detection of photon clusters by means of MST depends upon the mean spatial density of events, which increases largely moving from the Galactic poles to the equator.
3.1. Primary selection
The division of the sky into several regions followed the same procedure as in 9Y. All the regions were quite broad to reduce the effect of very rich clusters on Λm, but the increase in photon density due to the longer exposure required the use of the lower separation distance Λcut = 0.6 Λm instead of 0.7 Λm that was used in the 9Y, while Ncut remained equal to 3. The resulting lists of clusters in the various regions were merged together and a first preliminary set of 4841 clusters was obtained, including double detections in the overlapping strips. The results of this primary selection and the properties of the search regions are summarised in Table 1.
Sky regions used in the MST search for photon clusters.
To illustrate this primary selection, Fig. 1 shows an image of the photon field around the north Galactic pole with the detected clusters. There are two close large clusters, but many others have far fewer photons.
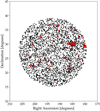 |
Fig. 1. Map of photons at energies higher than 10 GeV in a region centred at the north Galactic pole and with a radius of 12°. Individual photons are represented by black points, and those in the clusters after the primary selection are shown in red. The two close large clusters correspond to the well-known BL Lac objects 5BZB J1217+3007 (ON 325) and 5BZB J1221+3010 (1ES 1218+304). |
The criteria adopted in the primary selection are generally weak, and it cannot be excluded that a fraction of clusters with a low number of photons originated from statistical fluctuations of the background photon density or were caused by the occurrence of extended local enhancements, and therefore they cannot be related to genuine γ-ray sources. The application of stronger selection criteria is then necessary to reduce the number of these spurious detections. Nevertheless, making this further selection can exclude some true clusters (i.e., clusters that are really associated with sources), and therefore a reasonable trade-off must be taken into account.
Several types of spurious clusters are possible. Photon density fluctuations are more relevant for clusters with a low number of photons, for example, four or five, which is just above the elimination threshold. These clusters can be found in the surroundings of particularly rich clusters (typically with n above a few hundred) associated with bright sources. As we discuss in Sect. 4.1, these rich clusters have Rmax in the range between ∼20′ and ∼40′, and the possibility of finding one or two clusters that are disconnected from the rich cluster by a single edge with a length just above Λcut is not negligible. These structure are called satellite clusters.
Other spurious features can be found in the regions in which the local photon density is slightly higher than the mean density, as is observed when the Galactic belt is approached. In these regions some clusters with a low density (below the selection threshold) might be connected by one or two background photons and thus build a structure with a number of photons ∼10 and g typically lower than 3 (in a few cases lower than 2), but they produce a value of M above the threshold and have a spatial extension higher than 10′. These bridged clusters (Sect. 4.3), however, cannot simply be ruled out because they can include a small sub-cluster that corresponds to a genuine source, and further analyses are useful to determine their nature.
3.2. Secondary selections
As we did for the 9Y catalogue, stronger ‘superselection’ criteria were applied for sorting clusters with high significance. This procedure has been proved to be efficient in accounting for the background non-uniformities, increasing the probability of selecting clusters that correspond to genuine candidate γ-ray sources. These criteria consist in different threshold values on M and g, proportional to the mean photon density. The threshold values were chosen the same for the 9Y, that is, for high latitudes and poles, |b|> 50°: M > 18 or g > 3.5; for middle latitudes, 30° < |b|< 50°: M > 20 or g > 4.0; for the external peri-Galactic belt, 20° < |b|< 30° with 0° < l < 330°: M > 22 or g > 4.2; for the central peri-Galactic belt, 20° < |b|< 30° with −30° < l < 30°: M > 24 or g > 5.0;
The alternative (or) above is intended in the Boolean sense, that is, we selected clusters with either M > 18 or g > 3.5 for the Galactic poles. For some clusters, a more detailed analysis is necessary either to avoid spurious features or to resolve coupled structures, as discussed in Sect. 4. A new final set of 1664 clusters was thus obtained, which are all included in the 12Y-MST catalogue. These are 322 clusters more than in 9Y.
The thresholds quoted above are rather severe and reject the majority of spurious clusters, but they might also filter out some real features related to genuine sources, particularly in sky regions with low background. To obtain a more complete listing of clusters, we performed another secondary selection with slightly lower threshold values, except in the fourth region closer to the Galactic centre. The parameters are: for the igh latitudes and poles, |b|> 50°: M > 15 or g > 3.0; for the middle latitudes, 30° < |b|< 50°: M > 18 or g > 3.5; ‘for the external peri-Galactic belt, 20° < |b|< 30° with 0° < l < 330°: M > 20 or g > 4.0; for the central peri-Galactic belt, 20° < |b|< 30° with −30° < l < 30°: M > 24 or g > 5.0.
The application of these weak (w) selection criteria resulted in an additional sample of 224 clusters (called 12Y-MSTw). This increased the total number to 1888.
The numbers of candidate sources in each region resulting from both the standard (s) and the weak (w) selection are also given in Table 1.
4. Satellite and bridged clusters
As stated in Sect. 3.1, the two superselected catalogues contain a small number of clusters with some anomalous values of the parameters, which can be due to relatively rare occurrences, such as that of a very rich cluster in the neighbourhood, or to an unresolved close pair of sources, and so on. A certain identification of these clusters requires more specific analyses in smaller fields with properly suited selection values. In the following subsections we discuss the main types of these peculiar clusters. They are reported in the final catalogue accompanied by special notes.
4.1. Satellite clusters
Satellite clusters may be spurious features found in the surroundings of a rich broad cluster, that is, a large cluster with very many photons, typically n ≳ 50 and Rmax ≳ 20′. The entire 12Y-MST catalogue contains 110 sources with a maximum radius above the latter threshold, that is, 6.6% of the entire catalogue. The possible satellite clusters are found to be individual minor structures that are not joined to the main structure because several photons may be at a distance just exceeding the separation length.
A good example is shown in Fig. 2. The figure shows the photon map in a small field around a rich cluster (n = 371), corresponding to the blazar 5BZQ J1512-0905 (PKS 1502+106, Abdo et al. 2010). Seven other clusters, indicated by letters from A to G, are found by MST with the primary selection, but three of them (D, E, and F) are ruled out in the secondary selection. Cluster B, with 9 photons and a low g, is relatively large and lacks any concentration close to the centroid position, as expected for point-like sources. It can be considered a satellite cluster. On the other hand, clusters C and G, with 14 and 10 photons, respectively, are clearly separated from the rich central cluster. Their M values are higher than the threshold, as is typical of genuine sources. Cluster A has a more uncertain status: it has only 6 photons, but a high g = 4.3, its distance from the rich cluster is larger than that of satellite B, and it is therefore likely to be a genuine cluster, even if the possibility of a localised background fluctuation cannot be fully excluded.
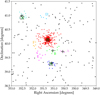 |
Fig. 2. γ-ray field around the very rich cluster 12Y-MST J1512-0906 (red circles), showing the clusters found by MST after the primary selection. Other coloured circles are the clusters in this region (also indicated by a letter), black crosses are the positions in the 12Y catalogue, large black squares are 4FGL sources, and green crosses correspond to the position of blazar-like objects. Clusters D, E, and F are rejected in the secondary selection. |
More focused searches were performed to sort possible satellites in the catalogue by applying a simple algorithm that selects pairs of clusters with an angular separation within the sum of their Rmax values increased by 10%. The structures of these pairs were then analysed by applying different Λcut in small fields. Generally, satellite clusters do not correspond to genuine γ-ray sources, but they were not removed from the catalogue in any case. They are identified by the note ‘sat’.
4.2. Halo clusters
Some small clusters are characterised by a median radius Rm that is close to the average value, but a maximum radius that exceeds the corresponding typical values by far. The simplest explanation is that one or two photons are in the surrounding background, with a separation from the nearest photon of the cluster just below Λcut. Therefore they are connected to the cluster itself. In the regions in which the background density is higher than the average, for instance close to the low Galactic latitude boundary, these structures are more likely detected. They are individual sources, but have an extended halo that is due to local background events. A method for verifying the nature of the so-called halo clusters is to perform another primary selection with a lower Λcut, comparing the parameters with the previous halo cluster and verifying whether the values of Rmax decrease. In the 12Y catalogue, clusters with a possible halo structure are indicated with the note ‘Hc’, and their parameters are those obtained from narrow-field analysis with a more correct Λcut.
4.3. Bridged clusters
Bridged clusters are clusters that lie at a short angular distance and are connected in a unique structure by one or more background photons at angular distances smaller than the separation length in the field. They are rarer than satellite clusters. The likelihood of finding such a structure is higher in dense fields, likely those at low Galactic latitude. A simple criterion for identifying candidate bridged clusters is based on the comparison of Rm and Rmax: A good indicator is a value of Rmax much higher than the typical value for clusters with a similar number of photons, together with a large Rm because the centroid position may be located in the low-density gap between the two nearby features. Another indication for the possible occurrence of a bridged structure are two nearby likely counterparts at an angular distance smaller than Rmax.
A rather simple method for verifying that two clusters are really connected consists of performing another MST analysis in a small field with a typical size of 10° ×10° or slightly larger, that is selected to avoid nearby very rich clusters, which can strongly reduce the mean distance between photons. When the primary selection is iterated with a decreasing Λcut, the cluster is divided into two close structures with values of g and M above the threshold, and the bridged cluster can be considered to be resolved into its components.
An example is the cluster 12Y-MST J0843+6706, which has 22 photons,  and
and  . As we discuss in Sect. 5, only very few clusters have such a high Rm. A map of a small sky region of only
  centred at the position of this cluster is shown in Fig. 3. The left panel shows the cluster detected with the original separation length: There is no central concentration around the centroid (red cross), as expected for a point-like source, and the two 4FGL counterparts are at a larger distance than is generally measured for other associations. However, several photons at l = 148° connect two smaller structures. The right panel of Fig. 3 shows the clusters obtained by computing the MST in a field that extends 20° in longitude and 10° in latitude, with Λcut = 0.5. The two bridging photons are excluded, and there are now two clusters of 10 photons each, whose centroids are correctly located and nearly coincident with the 4FGL positions.
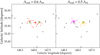 |
Fig. 3. Photon map of the sky region around cluster 12Y-MST J0843+6706. Left panel: black points are background photons, and red points are photons in the cluster after the selection with Λcut = 0.6 Λm. The red cross marks the centroid position, and the two green crosses are the positions of 4FGL sources. Right panel: same field after the analysis with Λcut = 0.5 Λm. The magenta and orange points are the photons of the two resulting clusters. |
In the 12Y catalogue, clusters with a possible bridge structure are indicated with the note ‘Bc’, followed by a letter to relate the uncoupled clusters. Their reported properties refer to the resolved components.
In some cases, however, only one of the resolved clusters has parameters that are high enough to exceed the secondary selection thresholds. Only the good cluster is included in the catalogue. In a few rare cases, a bridge or a halo pattern in a cluster cannot be easily recognised unless the components are separated by applying a very short Λcut. These cases are indicated with the note ‘HBc’.
The rich cluster 12Y-MST J0348-2750 with n = 353,  and
and  is an interesting peculiar case. This maximum radius is the largest in the catalogue. Clusters that are even richer, up to 1000 photons and more, have lower values of Rmax. The median radius is instead comparable to those of similar clusters. This anomaly suggests that it may be an unresolved system. A MST search in a small field with Λcut reduced to 0.4 resolved three clusters. The richest has 304 photons and
  , which agrees very well with other typical values. The other two have only 7 and 5 photons, but high g and magnitudes M that exceed the secondary selection threshold. In particular, the cluster with 7 photons corresponds to a 4FGL source and is nearly coincident with a blazar counterpart. The third closer and poorer cluster might indeed be a satellite.
5. 12Y-MST catalogue
5.1. General cluster properties
In the following we describe some general properties of the selected clusters in the main 12Y catalogue and the distribution of their parameters, while those of the 12Yw addendum are presented in Sect. 5.2. The first property is the number of photons (Fig. 4). Because of the primary selection, this number is equal to or greater than 4. The highest number of photons found in a single cluster is 2503, and this corresponds to the well-known BL Lac object Mk 421. However, the median of the distribution is at nmd = 10, and only 25% of clusters have n > 20.
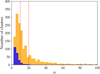 |
Fig. 4. Orange histogram: photon number in the clusters of the 12Y-MST catalogue. Violet histogram: clusters without a corresponding source in the 4FGL catalogue. The horizontal range is limited to 100 to clearly show the distribution for the clusters with low photon numbers. The vertical lines mark the median and the 75th percentile. |
We showed that a useful parameter to describe the spatial structure of clusters is Rmax. This radius is generally larger than the instrumental PSF, and in a few very rich clusters can exceed 30′. The histogram of Rmax is reported in Fig. 5. As expected, the large majority of clusters has a maximum radius smaller than 20′, and the median value of the distribution is 9 6. As mentioned above, it is useful to perform a further analysis for the largest clusters to verify whether they are bridged or halo clusters, although it cannot be excluded that some of them correspond to extended structures. Extended features are generally found close to the Galactic equator, but a few of them are in the LMC region.
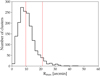 |
Fig. 5. Histogram of the maximum radius of the clusters of the 12Y-MSTs catalogue. The vertical lines mark the median and the 95th percentile. |
The behaviour of Rm is different because it results from the distributions shown in Fig. 6. For rich clusters, Rm approaches a value equal to 4 4, estimated by the mean for clusters with n > 90, with a remarkably low dispersion. The maximum radius increases slowly with n up to values higher than Rm by about one order of magnitude. Some outlier points correspond to halo clusters, as discussed above.
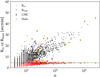 |
Fig. 6. Bivariate distributions of the photon number vs the radius delimiting the circle containing 50% of the photons, Rm (red triangles), and maximum radius (black squares) of the clusters in the 12Y-MSTs catalogue. Clusters with large haloes and in those in the LMC region are indicated. The horizontal line corresponds to the constant fit of the median radius of clusters with a number higher than 90. |
5.2. 12Y-MSTw sample
As discussed in Sect. 3.2, a different superselection that applied weaker thresholds than were used for the standard ‘strong’ 12Y-MST resulted in the additional 12Y-MSTw sample of 224 candidate sources. All these clusters have fewer than ten photons, and only ten clusters have g values higher than 4 and none is higher than 5. Therefore the possibility of including spurious clusters in this sample is expected to be higher than in the standard catalogue. Furthermore, four possible weak satellites of three rich clusters in the 12Y were found, indicated as usual by the note ‘sat’. The search for correspondences with other catalogues resulted in associations for about half of the sample. This confirms the usefulness of the weak selection.
6. Correspondences between 12Y-MST and other catalogues
6.1. 3FHL
The third Fermi-LAT Catalogue of High-Energy Sources, 3FHL (Ajello et al. 2017), contains 1556 entries corresponding to sources detected at energies higher than 10 GeV, 986 of which are at Galactic latitudes higher than 20°. In this subset, four sources are classified as extended: three of them are in the LMC region, and the last is centred on the active galaxy Fornax A (NGC 1316) and its surroundings. The observation time window of this catalogue is limited to the first seven years of observation, and more recent versions are not yet available. A search for correspondences with 12Y-MST clusters within an angular separation of 9′ gives 945 matches (95.8% of the 3FHL sample); only one source is at an angular separation higher than 6′. Considering that the 12Y catalogue has several clusters in the LMC region and another two in the Fornax A region (but their centroid coordinates do not match those of the 3FHL catalogue within the adopted distance), the number of effective correspondences might be increased to 948.
Eleven more associations are found by searching for correspondences between 3FHL and the 12-MSTw sample. A further analysis of clusters found in the primary selection whose parameters were below the secondary selection thresholds gave 16 more matches. As a conclusion, only 14 3FHL sources are not detected by MST algorithm, which is about 1.5% of the full catalogue.
This number of correspondences is only slightly higher than the one found for the 9Y (Campana et al. 2018a), as expected from the longer exposure of the current version. However, ten of the unassociated 3FHL sources are at Galactic latitudes lower than 30°, where the cluster search is less sensitive given the higher local background.
6.2. 4FGL-DR2 and other catalogues
The 4FGL-DR2 catalogue is the most recent version of the all sky γ-ray sources in the energy range from 50 MeV to 1 TeV released by the Fermi-LAT collaboration (Abdollahi et al. 2020; Ballet et al. 2020). The DR2 version is the most recent version on the Fermi-LAT website. It is based on data acquired in ten years of activity and has 5788 entries, 3237 of which are at |b|> 20°. A search for positional correspondences between our catalogues and 4FGL within an angular separation Δ ≤ 9′ resulted in 1430 associations (86%) for the 12Y-MST sample, with a mean angular distance between the centroid coordinates of the clusters and the 4FGL source position of  . The histogram of angular distances of these associations is reported in Fig. 7. Only 13 associations are at values of Δ higher than 6′ (only 6 of them above 7′). Their nature is discussed in Sect. 6.2.1.
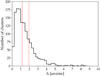 |
Fig. 7. Histogram of the angular separation between 12Y clusters and 4FGL counterparts. The red vertical lines mark the median and the 75th percentile. |
The number of chance random associations can be evaluated by considering the ratio of the solid angles covered by all the clusters in 12Y, assuming for each of them an angular radius equal to the radius used in the matching, and the solid angle of the whole explored sky. This ratio is equal to 4.328 × 10⁻³, and thus the expected number of random associations is 14. This is lower than what we found by two orders of magnitude and therefore confirms that almost all of the associations can be considered genuine.
The 12Y-MSTw and the 4FGL-DR2 contain 96 associations (about 43% of this sample) within the same matching distance. Only 6 sources lie above 6′. This notable number of further correspondences confirms the validity of the cluster detection. The Δm value is equal to 2 6, which is far lower than the instrumental PSF. This implies a good accuracy of the MST positional estimates.
The remaining set of 234 12Y-MST clusters that are not associated with 4FGL-DR2 sources was analysed. We found 3 other counterparts with the 3FGL catalogue (Acero et al. 2015).
Several candidate sources in this sample are in the LMC region where the local photon density is much higher than in the typical high-latitude sky. They might correspond to extended structures. One of them corresponds to a 3FGL source, while another two clusters confirm with a high significance the detection of the two supernovae remnants (SNRs) N 49B and N 63A (Campana et al. 2018b) found in the analysis of the nine-year LAT sky. A full analysis of the complex LMC region is beyond the scope of this paper and will be presented in a forthcoming paper.
Excluding these sources, we find that all the 12Y candidate sources with n > 18 are associated with 4FGL-DR2 sources. Only 26 of the 588 clusters with 9 ≤ n ≤ 18 do not have such correspondence.
Pulsars are another relevant class of high-energy sources, but only a small fraction of them is at high Galactic latitude. Therefore only few pulsars are expected to be in our catalogue. Only the millisecond pulsar PSR J0843+67 was reported in the 9Y-MST, and it is confirmed in 12Y. Moreover, PSR J2234+0944 is associated with a cluster in the 12Y-MSTw sample. Both sources are in the 4FGL-DR2 and in previous reports of the Fermi-LAT collaboration.
6.2.1. Associations at Δ> 6′
The histogram in Fig. 7 shows a quite small subset of 12Y-MST clusters that match 4FGL sources with an angular separation in the range 6′≤Δ ≤ 9′. This subset contains 13 clusters, that is, only 1% of the associated clusters, and therefore it cannot be excluded that they are the result of possible random proximity. The number of random associations with an angular distance in the previous range can be evaluated by means of the corresponding solid angle. We obtain an estimate of 8, which is significantly smaller than the associations we found.
Moreover, the source coordinates in the 4FGL catalogue are obtained from the analysis in a much broader energy band that extends to about 50 MeV. It is therefore possible that positional discrepancies higher than expected are found for a few sources.
The nature of the sources in this subset was accurately investigated, in particular for the search of possible counterparts. We found that ten of these clusters are associated with known blazars or candidates. Another cluster is at a distance of 1 8 from the position of a 3FGL source, while the others, all at large distances, are without counterpart.
6.3. TeV catalogues
The comparison of 12Y with available catalogues of sources detected at TeV energies requires particular attention because the sky coverage in this very high energy band is scarcely uniform. A catalogue of sources detected by many TeV observatories is available at the website of the University of Chicago2. A nearly complete list of known TeV sources, referred to as TeGeVcat (Carosi et al. 2015), is available at the ASI-SSDC website3. This catalogue is updated up to December 2018, and therefore some other recently reported (Acciari et al. 2020) were added. Another list (compiled by M. Mori) is available at the Ritsumeikan University4.
By combining the information provided by these catalogues, a list containing 79 entries at |b|> 20° was obtained, including some GRBs. When GRBs not detected by LAT above 10 GeV or outside the field of view are excluded, the useful sample for the comparison with 12Y is reduced to 75. Four sources lie in the LMC region.
We found 65 correspondences in the 12Y catalogue. Thirty-eight of these clusters have more than 50 photons and 51 clusters have more than 30 photons, but there is also a cluster with only 6 photons. The 12Y catalogue therefore includes a very large fraction of the TeV sources detected in the sky with |b|> 20°, and therefore it may be profitably used to select several possible targets for future pointed TeV observations.
6.4. 9Y-MST
The comparison of the new 12Y-MST and the previous 9Y-MST catalogue is useful to evaluate the efficiency of the MST algorithm in detecting low-significance features and in determining their stability. We therefore searched for the correspondence of cluster centroid coordinates in the two catalogues within an angular distance of 10′ and found that 1206 of the 1342 9Y catalogue sources correspond to 12Y clusters (the mean distance is 0 8, the maximum distance is 8′, but only 3 clusters have a distance higher than 6′). The remaining 137 sources are without correspondence. Many of these unassociated 9Y clusters were rejected by the severe thresholds of the secondary selection on the 12Y dataset, however. Twenty-four of them are in fact included in the catalogue of the weak selection. Another 49 clusters were found in the primary selection, but their parameters were too low to exceed any threshold, and 3 clusters are in the LMC region, where a safe correspondence is biased by the high photon density. This means that the number of 9Y clusters that are ‘lost’ is 61, corresponding to 4.6% of the total sources in this catalogue. This value can be compared with the percentage of 3FGL sources that are not included in the 4FGL within a radius of 15′, which is about 13%. Forty of the 9Y-lost clusters have 4 or 5 photons, and the 6 clusters with n > 9 have g values lower than 2.6, and in one case, as low as 1.8. Therefore the parameters of these clusters were generally just above the selection thresholds.
7. New high-energy detections of blazars and blazar candidates
It is well established that the large majority of extragalactic γ-ray sources are active galactic nuclei of blazar type (Massaro et al. 2015a). We therefore searched for a possible blazar association in the subsample of newly detected candidate sources in the 12Y and 12Yw catalogues using the 5BZCAT catalogue (Massaro et al. 2014, 2015b, the most complete available blazar sample, although not updated with recent findings). This search resulted in 833 associations with 12Y clusters within a distance of 6′, and other 8 associations within 8′. There are therefore 107 (or 113 within the latter distance) new blazar counterparts, 17 of which do not have a corresponding source in the 4FGL or in the 9Y catalogues. These are therefore new detections. The same search for the 128 unassociated clusters in the 12Yw resulted in 7 more new associations with 5BZCAT objects. In total, 24 new detections of blazars above 10 GeV are reported, and their 5BZCAT identifications are given in the notes.
In the past years, several papers have reported lists of blazar candidates that were identified by applying different selection criteria based on the occurrence of some of their typical properties. We investigated whether some of these objects might be associated with 12Y clusters without correspondences in the 4FGL catalogue because possible known counterparts are already reported there. This search in the sample of 234 clusters provided 34 possible associations with candidate blazars. The breakdown is as follows: 5 in KDEBLLACS5, 2 with WIBRaLS26, one from ROXA7, 16 in 2WHSP8, and 10 (one cluster with a double association in the Fornax region) in CRATES9. A similar analysis of the additional 12Yw list resulted in 8 more associations (2 in KDEBLLACS, 3 in 2WHSP, and 3 in CRATES). The total number of detections of confirmed blazars and candidates thus increases to 42. Again, all these possible counterparts are reported in the catalogues as notes.
As an example, Table A.1 reports the first 30 12Y catalogue entries without association to 4FGL sources, ordered by right ascension. The full catalogue is provided in electronic format through the CDS.
8. Summary and discussion
The 9Y-MST catalogue of γ-ray candidate sources, based on the first nine years of Fermi-LAT data, has been extended to include three more years of observations, thus producing the new 12Y-MST catalogue. Pass 8 events were selected at energies higher than 10 GeV and Galactic latitude |b|> 20°, and the MST algorithm was applied to detect photon clusters. As for the 9Y, after the primary selection, severe threshold values were adopted to reduce the possibility of spurious detections due to local background fluctuations. A new catalogue of 1664 candidate sources was obtained. These are 322 (24%) more than in the 9Y catalogue.
By applying weaker selection criteria, an additional sample of clusters was selected, with a lower significance, but useful to achieve a richer sample of possible high-energy sources. This 12Y-MSTw catalogue consists of 224 additional clusters to the 12Y for a total of 1888 candidate sources. This total number is about twice those reported in the 3FHL catalogue in same sky regions and energy band.
About 80% of the 12Y clusters have a very good positional correspondence with sources reported in the recent 4FGL-DR2 catalogue of the Fermi-LAT collaboration. The remaining 20%, or at least a significant fraction of them, are expected to be the high-energy counterpart of blazar-like AGNs. Moreover, almost all the confirmed TeV sources in the investigated regions of the sky are included in the 12Y. As a consequence, the catalogue can be used to derive a sample of possible targets for current and future very high energy observatories.
A search for new possible blazar candidates was carried out within a region centred at the 12Y or 12Yw cluster centroid coordinates. The region had a radius of 6′. The search was based on possible optical or IR counterparts of radio sources, when present, or of quasars or candidates reported in large databases. As a result, 24 new detections of blazars that were reported in the 5BZCAT were obtained and another 42 possible associations with blazar candidates. Moreover, possible interesting radio and IR sources are located within a few arcminutes from the positions of severa cluster centroids. Further observational studies are required to confirm them as reliable counterparts.
Version 3.400 at http://tevcat.uchicago.edu/
Kernel Density Estimation BL Lacs, D’Abrusco et al. (2019).
WISE Blazar-like Radio-Loud Sources, D’Abrusco et al. (2019).
Radio-Optical-X-ray catalog, Turriziani et al. (2007).
WISE High Synchroton Peaked blazars, Chang et al. (2017).
Combined Radio All-Sky Targeted Eight GHz Survey, Healey et al. (2007).
Acknowledgments
We acknowledge use of archival Fermi data. We made large use of the online version of the Roma-BZCAT and of the scientific tools developed at the ASI Science Data Center (ASDC), of the final release of 6dFGS archive, of the Sloan Digital Sky Survey (SDSS) archive, of the NED database and other astronomical catalogues distributed in digital form (Vizier and Simbad) at Centre de Dates astronomiques de Strasbourg (CDS) at the Louis Pasteur University. This research has made use the TeVCat online source catalog (http://tevcat.uchicago.edu).
References
- Abdo, A. A., Ackermann, M., Ajello, M., et al. 2010, ApJ, 715, 429 [NASA ADS] [CrossRef] [Google Scholar]
- Abdollahi, S., Acero, F., Ackermann, M., et al. 2020, ApJS, 247, 33 [NASA ADS] [CrossRef] [Google Scholar]
- Acciari, V. A., Ansoldi, S., Antonelli, L. A., et al. 2020, ApJS, 247, 16 [Google Scholar]
- Acero, F., Ackermann, M., Ajello, M., et al. 2015, ApJS, 218, 23 [Google Scholar]
- Ackermann, M., Ajello, M., Allafort, A., et al. 2013, ApJ, 765, 54 [Google Scholar]
- Ajello, M., Atwood, W. B., Baldini, L., et al. 2017, ApJS, 232, 18 [NASA ADS] [CrossRef] [Google Scholar]
- Ballet, J., Burnett, T. H., Digel, S. W., & Lott, B. 2020, ApJ, 247, 33 [Google Scholar]
- Bernieri, E., Campana, R., Massaro, E., Paggi, A., & Tramacere, A. 2013, A&A, 551, L5 [EDP Sciences] [Google Scholar]
- Campana, R., Massaro, E., Gasparrini, D., Cutini, S., & Tramacere, A. 2008, MNRAS, 383, 1166 [Google Scholar]
- Campana, R., Bernieri, E., Massaro, E., Tinebra, F., & Tosti, G. 2013, Ap&SS, 347, 169 [Google Scholar]
- Campana, R., Massaro, E., Bernieri, E., & D’Amato, Q. 2015, Ap&SS, 360, 19 [Google Scholar]
- Campana, R., Massaro, E., & Bernieri, E. 2016a, Ap&SS, 361, 183 [Google Scholar]
- Campana, R., Massaro, E., & Bernieri, E. 2016b, Ap&SS, 361, 185 [Google Scholar]
- Campana, R., Massaro, E., & Bernieri, E. 2016c, Ap&SS, 361, 367 [Google Scholar]
- Campana, R., Maselli, A., Bernieri, E., & Massaro, E. 2017, MNRAS, 465, 2784 [Google Scholar]
- Campana, R., Massaro, E., & Bernieri, E. 2018a, A&A, 619, A23 [NASA ADS] [CrossRef] [EDP Sciences] [Google Scholar]
- Campana, R., Massaro, E., & Bernieri, E. 2018b, Ap&SS, 363, 144 [Google Scholar]
- Carosi, A., Antonelli, L. A., Giommi, P., & Lucarelli, F. 2015, in 34th International Cosmic Ray Conference (ICRC2015), 34, 757 [Google Scholar]
- Chang, Y. L., Arsioli, B., Giommi, P., & Padovani, P. 2017, A&A, 598, A17 [NASA ADS] [CrossRef] [EDP Sciences] [Google Scholar]
- Cormen, T., Leiserson, C., Rivest, R., & Stein, C. 2009, Introduction to Algorithms, 3rd edn. (Cambridge, USA: MIT Press) [Google Scholar]
- D’Abrusco, R., Álvarez Crespo, N., Massaro, F., et al. 2019, ApJS, 242, 4 [Google Scholar]
- Healey, S. E., Romani, R. W., Taylor, G. B., et al. 2007, ApJS, 171, 61 [NASA ADS] [CrossRef] [Google Scholar]
- Massaro, E., Maselli, A., Leto, C., et al. 2014, Multifrequency Catalogue of Blazars - 5th Edition [Google Scholar]
- Massaro, F., Thompson, D. J., & Ferrara, E. C. 2015a, A&ARv, 24, 2 [Google Scholar]
- Massaro, E., Maselli, A., Leto, C., et al. 2015b, Ap&SS, 357, 75 [NASA ADS] [CrossRef] [Google Scholar]
- Turriziani, S., Cavazzuti, E., & Giommi, P. 2007, A&A, 472, 699 [NASA ADS] [CrossRef] [EDP Sciences] [Google Scholar]
Appendix A: Additional table
First 30 entries in the 12Y-MST catalogue not associated with any 4FGL Fermi-LAT source.
All Tables
First 30 entries in the 12Y-MST catalogue not associated with any 4FGL Fermi-LAT source.
All Figures
|
Fig. 1. Map of photons at energies higher than 10 GeV in a region centred at the north Galactic pole and with a radius of 12°. Individual photons are represented by black points, and those in the clusters after the primary selection are shown in red. The two close large clusters correspond to the well-known BL Lac objects 5BZB J1217+3007 (ON 325) and 5BZB J1221+3010 (1ES 1218+304). |
| In the text | |
|
Fig. 2. γ-ray field around the very rich cluster 12Y-MST J1512-0906 (red circles), showing the clusters found by MST after the primary selection. Other coloured circles are the clusters in this region (also indicated by a letter), black crosses are the positions in the 12Y catalogue, large black squares are 4FGL sources, and green crosses correspond to the position of blazar-like objects. Clusters D, E, and F are rejected in the secondary selection. |
| In the text | |
|
Fig. 3. Photon map of the sky region around cluster 12Y-MST J0843+6706. Left panel: black points are background photons, and red points are photons in the cluster after the selection with Λcut = 0.6 Λm. The red cross marks the centroid position, and the two green crosses are the positions of 4FGL sources. Right panel: same field after the analysis with Λcut = 0.5 Λm. The magenta and orange points are the photons of the two resulting clusters. |
| In the text | |
|
Fig. 4. Orange histogram: photon number in the clusters of the 12Y-MST catalogue. Violet histogram: clusters without a corresponding source in the 4FGL catalogue. The horizontal range is limited to 100 to clearly show the distribution for the clusters with low photon numbers. The vertical lines mark the median and the 75th percentile. |
| In the text | |
|
Fig. 5. Histogram of the maximum radius of the clusters of the 12Y-MSTs catalogue. The vertical lines mark the median and the 95th percentile. |
| In the text | |
|
Fig. 6. Bivariate distributions of the photon number vs the radius delimiting the circle containing 50% of the photons, Rm (red triangles), and maximum radius (black squares) of the clusters in the 12Y-MSTs catalogue. Clusters with large haloes and in those in the LMC region are indicated. The horizontal line corresponds to the constant fit of the median radius of clusters with a number higher than 90. |
| In the text | |
|
Fig. 7. Histogram of the angular separation between 12Y clusters and 4FGL counterparts. The red vertical lines mark the median and the 75th percentile. |
| In the text | |
Current usage metrics show cumulative count of Article Views (full-text article views including HTML views, PDF and ePub downloads, according to the available data) and Abstracts Views on Vision4Press platform.
Data correspond to usage on the plateform after 2015. The current usage metrics is available 48-96 hours after online publication and is updated daily on week days.
Initial download of the metrics may take a while.