Fig. 6.
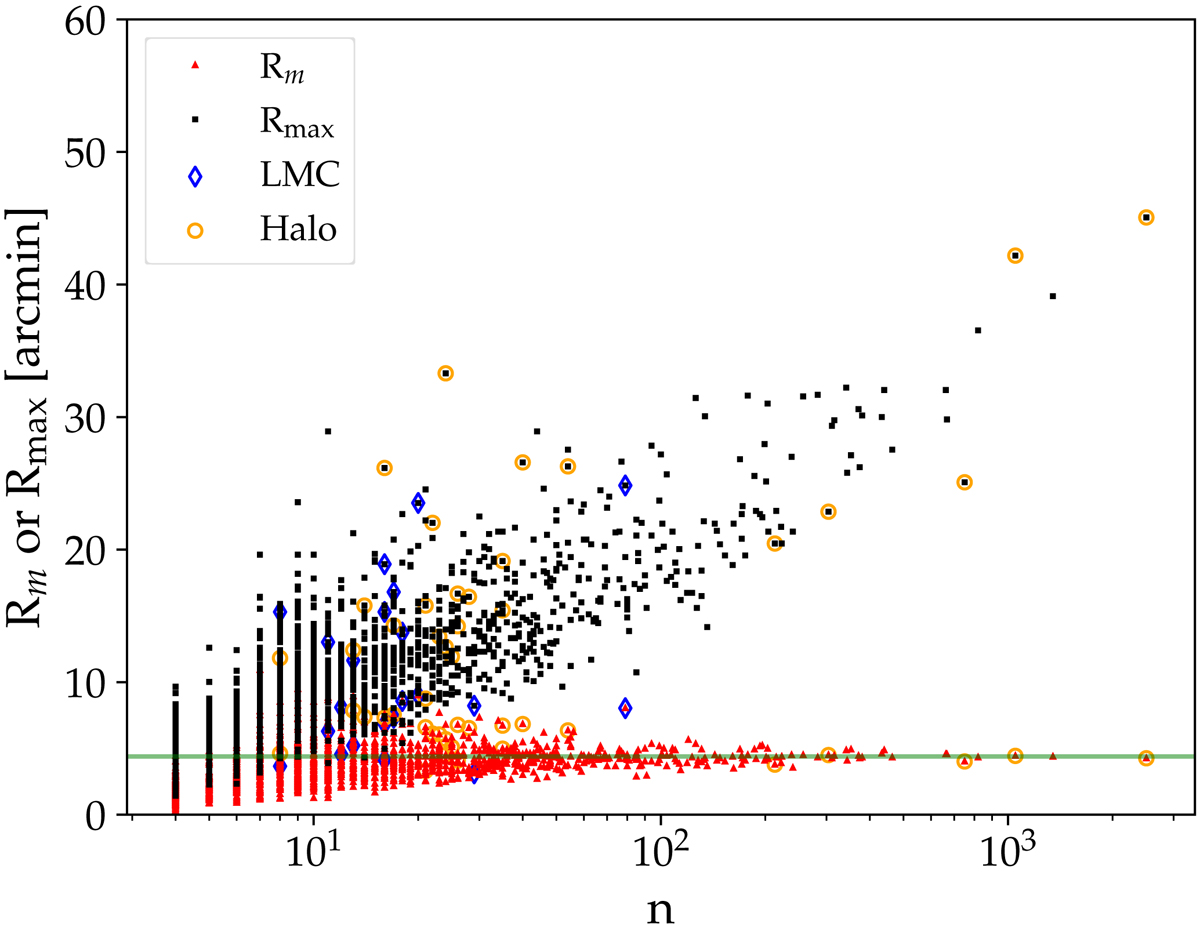
Bivariate distributions of the photon number vs the radius delimiting the circle containing 50% of the photons, Rm (red triangles), and maximum radius (black squares) of the clusters in the 12Y-MSTs catalogue. Clusters with large haloes and in those in the LMC region are indicated. The horizontal line corresponds to the constant fit of the median radius of clusters with a number higher than 90.
Current usage metrics show cumulative count of Article Views (full-text article views including HTML views, PDF and ePub downloads, according to the available data) and Abstracts Views on Vision4Press platform.
Data correspond to usage on the plateform after 2015. The current usage metrics is available 48-96 hours after online publication and is updated daily on week days.
Initial download of the metrics may take a while.