Fig. 8.
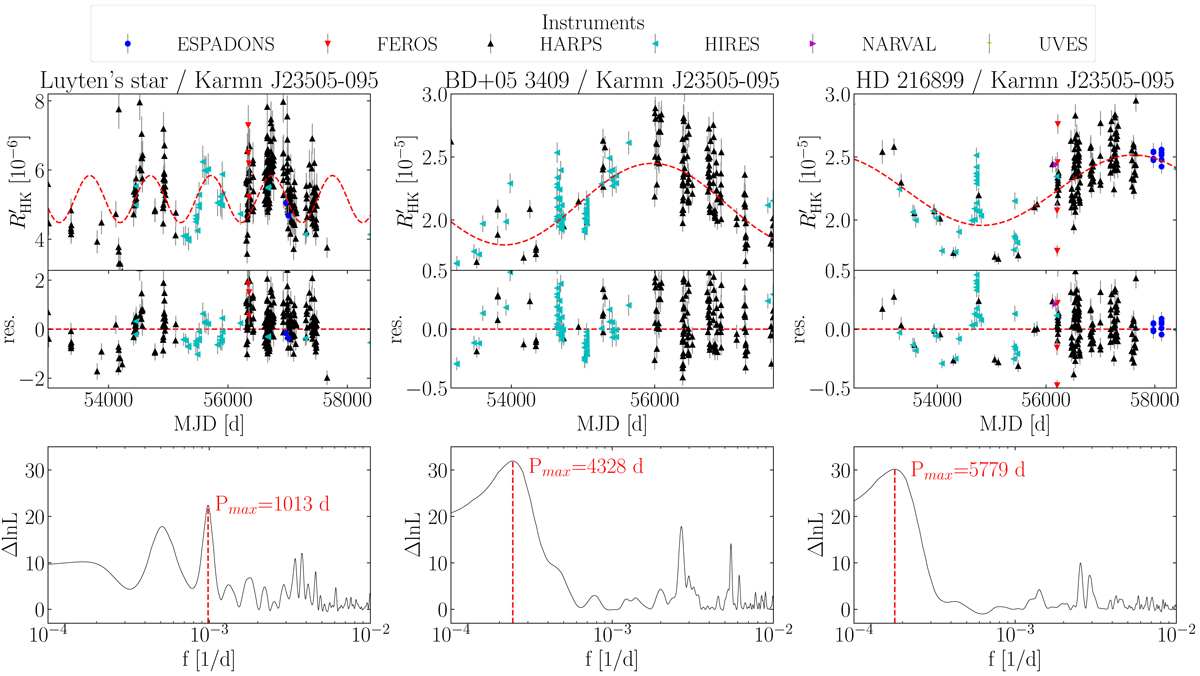
Analysis of the ![]() time series of three M dwarfs exhibiting new long-term cyclic modulation. Upper panels:
time series of three M dwarfs exhibiting new long-term cyclic modulation. Upper panels: ![]() time series for each star. The color coding and markers denote the instrument (see legend to the right) and the red dashed line is the best-fit sine function. Middle panels: residuals after subtraction of the best fit. Bottom panels: GLS periodogram of the time series. The vertical dashed line marks the period with the highest power.
time series for each star. The color coding and markers denote the instrument (see legend to the right) and the red dashed line is the best-fit sine function. Middle panels: residuals after subtraction of the best fit. Bottom panels: GLS periodogram of the time series. The vertical dashed line marks the period with the highest power.
Current usage metrics show cumulative count of Article Views (full-text article views including HTML views, PDF and ePub downloads, according to the available data) and Abstracts Views on Vision4Press platform.
Data correspond to usage on the plateform after 2015. The current usage metrics is available 48-96 hours after online publication and is updated daily on week days.
Initial download of the metrics may take a while.