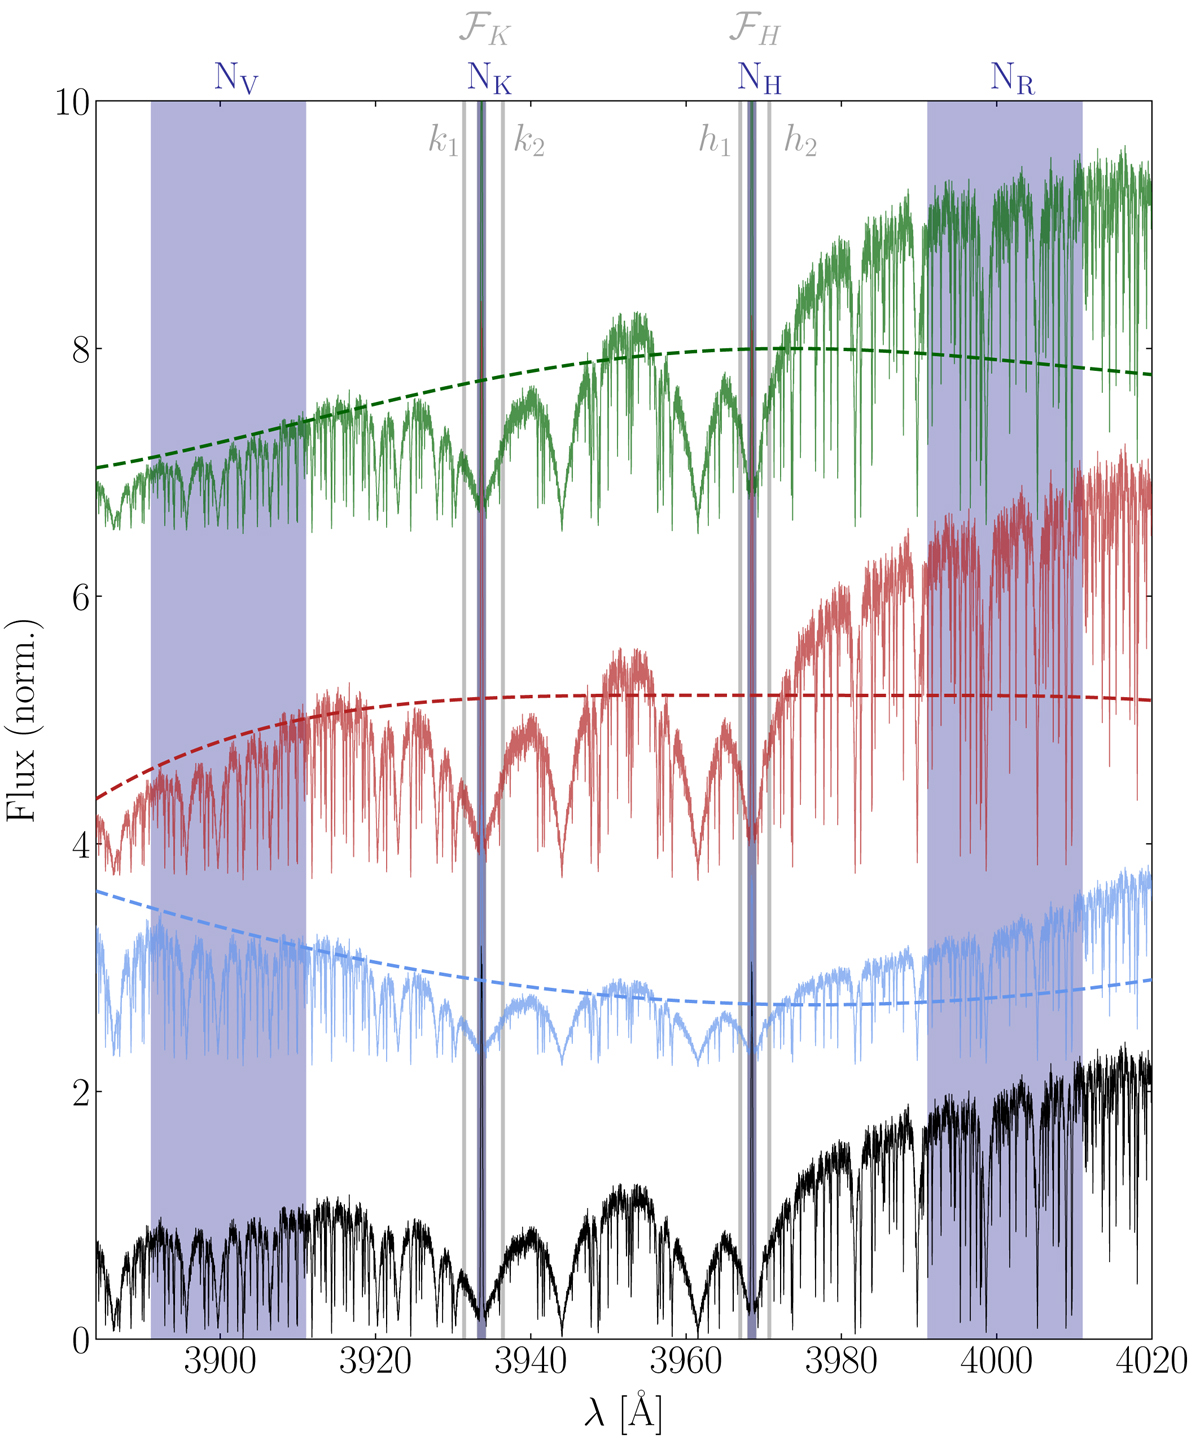
Fig. 4.

Example of the artificial instrumental errors. The original HARPS spectrum of Gl 526 (Karmn J13457+148) is displayed at the bottom as a black line, while the polynomials with coefficients stated in Sect. 2.3 and the resulting spectra are shown in blue, red, and green, respectively. The shaded gray areas mark the regions used for the extraction of ![]() in this publication, whereas the blue regions highlight the bands NH, NK, NV, and NR commonly used for the determination of the S index.
in this publication, whereas the blue regions highlight the bands NH, NK, NV, and NR commonly used for the determination of the S index.
Current usage metrics show cumulative count of Article Views (full-text article views including HTML views, PDF and ePub downloads, according to the available data) and Abstracts Views on Vision4Press platform.
Data correspond to usage on the plateform after 2015. The current usage metrics is available 48-96 hours after online publication and is updated daily on week days.
Initial download of the metrics may take a while.


