| Issue |
A&A
Volume 652, August 2021
|
|
|---|---|---|
| Article Number | A139 | |
| Number of page(s) | 8 | |
| Section | Stellar atmospheres | |
| DOI | https://doi.org/10.1051/0004-6361/202140796 | |
| Published online | 24 August 2021 | |
Curiouser and curiouser: the peculiar chemical composition of the Li- and Na-rich star in ω Centauri★
1
Dipartimento di Fisica e Astronomia Augusto Righi, Università degli Studi di Bologna,
Via Gobetti 93/2,
40129
Bologna,
Italy
e-mail: This email address is being protected from spambots. You need JavaScript enabled to view it.
2
INAF – Osservatorio di Astrofisica e Scienza dello Spazio di Bologna,
Via Gobetti 93/3,
40129
Bologna,
Italy
3
Departamento de Ciencias Fisicas, Universidad Andres Bello,
Fernandez Concha 700,
Las Condes,
Santiago,
Chile
4
GEPI, Observatoire de Paris, PSL Research University, CNRS,
Place Jule Janssen 92190,
Meudon,
France
5
Astrophysics Research Institute, Liverpool John Moores University,
146 Brownlow Hill,
Liverpool
L3 5RF,
UK
6
European Southern Observatory,
Alonso de Cordova 3107,
Vitacura,
Santiago,
Chile
7
INAF – Osservatorio Astronomico di Padova,
Vic. del Osservatorio 5,
35122
Padova,
Italy
Received:
12
March
2021
Accepted:
5
June
2021
Abstract
We present a multi-instrument spectroscopic analysis of the unique Li- and Na-rich giant star #25664 in ω Centauri, using spectra acquired with FLAMES-GIRAFFE, X-shooter, UVES, and HARPS. Li and Na abundances have been derived from the UVES spectrum using transitions weakly sensitive to non-local thermodynamic equilibrium and assumed isotopic ratios. This new analysis confirms the surprising Li and Na abundances of this star (A(Li)NLTE = +2.71 ± 0.07 dex, [Na/Fe]NLTE = +1.00 ± 0.05 dex). Additionally, we provide new pieces of evidence for its chemical characterisation. The 12C∕13C isotopic ratio (15 ± 2) shows that this star has not yet undergone the extra-mixing episode usually associated with the red giant branch bump. Therefore, we can rule out the scenario of efficient deep extra mixing during the red giant branch phase envisaged to explain the high Li and Na abundances. Also, the star exhibits high abundances of both C and N ([C/Fe] = +0.45 ± 0.16 dex and [N/Fe] = +0.99 ± 0.20 dex), which is not compatible with the typical C-N anti-correlation observed in globular cluster stars. We found evidence of a radial velocity variability in #25664, suggesting that the star could be part of a binary system, likely having accreted material from a more massive companion when the latter was evolving in the asymptotic giant branch (AGB) phase. Viable candidates for the donor star are AGB stars with 3–4 M⊙ and super-AGB stars (~7–8 M⊙), both of which are able to produce Li- and Na-rich material. Alternatively, the star could have formed from the pure ejecta of a super-AGB star before the dilution with primordial gas occurred.
Key words: stars: abundances / techniques: spectroscopic / globular clusters: individual: ω Centauri
Based on observations collected at the ESO-VLT under programmes 060.A-9700, 096.D-0728, 099.D-0258, and 0101.D-0620.
© ESO 2021
1 Introduction
The observed run of A(Li)1 in field halo and globular clusters (GCs) stars between [Fe/H] ~ –3.0 and –1.0 dex as a function of the stellar luminosity (or the surface gravity) is characterised by two plateaus and two drops (see e.g. Gratton et al. 2000; Lind et al. 2009a; Mucciarelli et al. 2012a). These drops are driven by the mixing episodes that occur during the evolution of low-mass stars. Upper main sequence stars exhibit a constant value of A(Li) (~2.1–2.3 dex), regardless of the effective temperature (Teff) and metallicity, the so-called Spite Plateau (Spite & Spite 1982; Rebolo et al. 1988; Bonifacio & Molaro 1997), which was originally interpreted as the signature of the Li abundance produced during the Big Bang nucleosynthesis.
When the surface convection reaches regions hotter than ~2.5 × 10⁶ K, where Li burns, Li-free material is dredged to the surface (first dredge-up), with a consequent reduction in the photospheric A(Li) by ~1.2 dex. After convection has attained its maximum depth at the end of the first dredge-up, stars fainter than the red giant branch (RGB) bump show a constant A(Li) ~ 1.0 dex (Mucciarelli et al. 2012a). The extra-mixing episode associated with the RGB bump leads to a subsequent depletion of the surface A(Li), which totally disappears from the stellar atmosphere (Charbonnel & Zahn 2007).
Li-rich stars are peculiar stars that contradict this framework, exhibiting surface A(Li) significantly higher (up to 3 dex) than those measured in stars of similar luminosity. These stars are rare, and they have been detected among all the evolutionary sequences, with evidence of a higher incidence during the red clump phase (Casey et al. 2019; Kumar et al. 2020). The origin of Li-rich starsis still debated; the three most popular scenarios envisaged to explain the enhancement of A(Li) are as follows.
The first is the engulfment of planets or brown dwarfs (Siess & Livio 1999; Aguilera-Gómez et al. 2016, 2020; Casey et al. 2016), which should increase the surface abundances of Be, 6Li, and 7Li (even if the original chemical abundances could be restored after a given time). This scenario is favoured in metal-rich stars with [Fe/H] > –0.5 dex (see Johnson et al. 2010; Casey et al. 2016) and in stars brighter than the RGB bump because the larger stellar radius favours the engulfment process.
The second is internal production of fresh Li through the Cameron-Fowler mechanism (Cameron & Fowler 1971). This mechanism can occur during the RGB phase if deep extra mixing is able to circulate matter between the base of the convective envelope and a region close to the H-burning shell (Boothroyd et al. 1995; Boothroyd & Sackmann 1999; Denissenkov & VandenBerg 2003). The Cameron-Fowler mechanism can also occur during the asymptotic giant branch (AGB) phase; in particular, asignificant production of Li is expected for the so-called super-AGB stars, which have masses between 7 and 8 M⊙, during the hot bottom burning phase (Ventura & D’Antona 2011; Doherty et al. 2014).
The third is external production of fresh Li. In this scenario the measured over-abundance of Li is the result of a mass transfer process in a binary system from a companion that had produced Li through the mechanisms described above.
The interpretation of Li-rich stars in GCs is complicated by the observed abundance (anti-)correlations among the light elements (i.e. He, C, N, O, Na, Mg, and Al) involved in the hot CNO cycles, which are usually interpreted as the outcome of a self-enrichment process that occurred in the early stage of life of the cluster (Bastian & Lardo 2018; Gratton et al. 2019). As a crude classification, we are used to dividing the cluster stars into two groups according to their light element abundances: first population (1P) stars, with abundance ratios that resemble those measured in field stars and metallicity similar to that of the cluster, and second population (2P) stars, which show the signature of the hot CNO cycle in their chemical composition (in particular, the Na-O anti-correlation observed in all old GCs).
The hot CNO cycle that produces the chemical anomalies observed in GCs occurs at temperatures higher than 107 K, one order of magnitude higher than that of Li burning. Therefore, 2P stars should be Li-free or at least show a significant difference in A(Li) with respect to 1P stars. Surprisingly, GCs with Li measurements display only small differences in A(Li) between 1P and 2P stars (Pasquini et al. 2005; González Hernández et al. 2009; Lind et al. 2009a; Monaco et al. 2012; Dobrovolskas et al. 2014), with the only remarkable exception being the multi-iron GC-like system ω Centauri (Johnson & Pilachowski 2010; Marino et al. 2011), which exhibits an extend Li-Na anti-correlation (Mucciarelli et al. 2018).
As of now, only 15 Li-rich stars have been discovered in GCs (see Fig. 3 in Sanna et al. 2020, and references therein). Among them, one of the two Li-rich stars discovered in ω Centauri by Mucciarelli et al. (2019) is particularly intriguing. The star, #25664, is a lower RGB (LRGB), meaning it is fainter than the RGB bump luminosity level. Its membership has been confirmed according to its measured radial velocity (RV; Mucciarelli et al. 2019) and proper motions (Bellini et al. 2009; Gaia Collaboration 2021)
It shows an enhancement of Li ( = +2.40 ± 0.06 dex) coupled with an extraordinarily high abundance of Na. The abundance from the Na I D lines is [Na/Fe] = +0.87 ± 0.07 dex (Mucciarelli et al. 2019), which is about 0.5 dex higher than the Na content measured in the most Na-rich stars in ω Centauri by Mucciarelli et al. (2018) using the same Na lines. These two uncommon chemical abundances make #25664 a peculiar and unique object, without similar counterparts in other GCs or among the field stars. As discussed by Mucciarelli et al. (2019), the enhancement of Li and Na in this star is compatible with both an internal production during the RGB phase (if the star experienced efficient deep mixing) and with Li production in super-AGB stars. In the latter case, #25664 could have formed directly from the pure ejecta of a super-AGB star (D’Antona et al. 2012), or it could be member of a former binary system that experienced a mass transfer of Li- and Na-rich material from its massive companion when the latter was in the super-AGB phase.
In this paper we present new spectroscopic observations of this star, measuring the abundances of Na and Li as well as C, N, O, Mg, Al, and K to provide a complete view of its chemical composition and try to explain its origin. The paper is organised as follows: Sect. 2 describes the observations, Sect. 3 describes the measure of the RVs, Sect. 4 presents the chemical analysis and the derived abundances, and Sect. 5 discusses the results.
2 Observations
A multi-instrument spectroscopic campaign has been performed to properly characterise the kinematics and chemistry of the peculiar Li- and Na-rich star #25664 in ω Centauri. The acquired spectroscopic datasets are the following (see Table 1).
2.1 FLAMES-GIRAFFE
With FLAMES-GIRAFFE (Pasquini et al. 2002) we secured one exposure with the setup HR12, two with HR13, and three with HR15N, observed between 2016 February 1 and 19 (Programme ID: 096.D-0728, PI: Mucciarelli). These observations are described and discussed in Mucciarelli et al. (2018, 2019).
2.2 X-shooter
X-shooter (Vernet et al. 2011) spectra of #25664 and of two comparison LRGB stars in ω Centauri were secured on the nights of 2017 June 16 and 17 (Programme ID:099.D-0258, PI: Origlia), with slits of 1.0″ and 0.9″ for the ultraviolet-blue (UVB) and visual (VIS) arms, respectively, corresponding to spectral resolutions of 5400 and 8900. The two comparison LRGB stars were selected from the sample by Mucciarelli et al. (2018); they have atmospheric parameters and metallicity very similar to those of #25664 but different Na abundances and hence belong to different cluster populations. The two stars are #77093 (1P), with [Na/Fe] = –0.29 dex, and #329049 (2P), with [Na/Fe] = +0.12 dex (Mucciarelli et al. 2018). The spectrum of #25664 was obtained with an exposure time of 1800 s, while 1200 s of integration were used for both the comparison stars. The observations were performed in nodding mode. The signal-to-noise ratio (S/N) per pixel is about 80–100 for the UVB arm and 50–60 for the VIS arm.
2.3 UVES
Two exposures of 1800 s and one exposure of 1200 s were obtained with UVES (Dekker et al. 2000) in the dichroic mode and with a slit of 1″ (providing a spectral resolution of about 40 000), in the blue arm setting CD#1 390 (ranging from 3280 to 4490 Å) and the red arm setting CD#3 580 (ranging from 4800 to 6800 Å), on the nights of 2018 June 7 and 8 (Programme ID:0101.D-0620, PI: Ferraro). The S/N per pixel around the Li line is about 65.
2.4 HARPS
The HARPS spectrograph (Mayor et al. 2003) provides a spectral resolution of 115 000 (in HAM mode) and 80 000 (in EGSS mode), ranging from 3780 to 6910 Å. In HAM mode, three exposures of 1200 s each were acquired on the night of 2018 June 26, three exposures of 1200 s each on the night of 2018 July 24, and one exposure of 3600 s on the night of 2019 February 20. One exposure of 3600 s in EGGS mode was secured on the night of 2021 January 26. Multiple exposures of the same night have been co-added together. The S/N per pixel around the Li line of these spectra ranges from about 5 to 10–11.
Observing log and RVs for individual epochs.
3 Radial velocities
For #25664,a RV of +227.8 ± 0.2 km s−1 has been provided by Mucciarelli et al. (2019) as an average of the RVs derived from the six individual GIRAFFE spectra. We derived RVs from the X-shooter, UVES, and HARPS spectra by cross-correlating them against appropriate synthetic template spectra calculated with the SYNTHE code (Sbordone et al. 2004; Kurucz 2005) and convoluted with a Gaussian profile to reproduce the instrumental broadening. The cross-correlation was performed with the IRAF2 task FXCOR. We checked the accuracy of the zero point of the wavelength calibration for each spectrum by cross-correlating emission and absorption telluric features against a synthetic spectrum of the Earth atmosphere calculated with TAPAS (Bertaux et al. 2014). Only for the X-shooter spectrum did we find a small offset, +1.3 km s−1, which we were able to account for.
Uncertainties in the RV measurement (from both photospheric and telluric lines) due to the photon noise, the spectral resolution, and the finite size of the pixel were estimated using Monte Carlo simulations. We added Poisson noise to a synthetic spectrum calculated with the stellar parameters of #25664 and to a synthetic Earth atmosphere spectrum, with the spectral resolution and the pixel size corresponding to each instrument. For each individual spectrum, a sample of 200 synthetic noisy spectra was generated and analysed as done for the observed spectra. The dispersion of the derived RV distribution was taken as the 1σ uncertainty in the RV measure. We added in quadrature the uncertainty related to the measure of RVs in emission and absorption telluric features.
All the individual heliocentric RVs are listed in Table 1, while Fig. 1 shows their behaviour as a function of the modified Julian date. All the measures are distributed over a range of about 2 km s−1, except that from the X-shooter spectrum, which is higher by ~7–8 km s−1 than the other RVs. Even if the RVs measured from X-shooter spectra are the most uncertain, we have no reason to exclude them or consider them less reliable. To support the validity of the RVs derived from X-shooter, we checked the RVs obtained for the two comparison stars with those measured by Mucciarelli et al. (2018) from the GIRAFFE spectra, finding a difference (RVXSH-RVGIR) of –0.8 km s−1 for #77093 and –0.5 km s−1 for #329049. The excellent agreement between the RVs from the X-shooter and GIRAFFE spectra for these two stars suggests that the RV of #25664 from the X-shooter spectrum is correct, or at least not affected by relevant biases.
Also, we found a difference of 1.8 km s−1 between the RVs from the last two HARPS spectra. This difference is also confirmed when we consider RVs derived with the HARPS pipeline (providing an offset of 1.7 km s−1 between the two epochs). Among the used instruments, HARPS provides the most reliable RVs because of its high spectral resolution and the excellent stability of the instrument. The real difference in the RVs of these two epochs can be appreciated in Fig. 2. The upper panels show portions of the two spectra (both corrected for the corresponding heliocentric correction) where the displacement between the lines is clearly visible. On the other hand, the position of the telluric lines of the two spectra (without applying the heliocentric correction) shown in the lower panel demonstrates that these spectra are perfectly aligned with each other. We conclude that star #25664 exhibits clear evidence of RV variability, which suggests that it is a member of a binary system. We also investigated the eventual photometric variability of #25664 within the long-term imaging monitoring of Momany et al. (2020). These authors collected a wide-field (ωCAM@VST) almost-simultaneous u∕r-Sloan monitoring of selected GCs that, in the case of ω Centauri, covered almost four years. The u∕r light curves of #25664 basically confirm that the star does not show any significant photometric variability (at least within a ~ 3σ level of their achieved photometric precision).
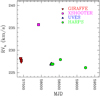 |
Fig. 1 Behaviour of heliocentric RVs as a function of the modified Julian date derived from the multi-instrument spectroscopic datasets listed in Table 1. Errors on RVs are smaller than the symbols. |
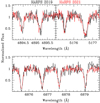 |
Fig. 2 Comparison between two HARPS spectra. Upper panels: portions of the HARPS spectra around some photospheric lines acquired in 2019 February (black line) and 2021 January (red line). The two spectra are corrected for the corresponding heliocentric correction. Lower panel: portions of the same HARPS spectra around telluric lines, without applying the heliocentric correction. |
4 Chemical abundances
The UVES spectrum was used to derive chemical abundances of Li, O, Na, Mg, Si, Ca, Ti, Fe, and Ni and to estimate the 12C ∕13C isotopic ratio (see Table 2), while the X-shooter spectrum was used to infer C, N, Al, Mg, and Fe abundances (see Table 3). Most solar reference abundances are from Grevesse & Sauval (1998), though those for C, N, and O are taken from Caffau et al. (2011).
We obtained abundances of Na, Mg, Si, Ca, Ti, Fe, and Ni from the UVES spectrum from the measured equivalent widths (EWs) using the code GALA (Mucciarelli et al. 2013). The EWs were measured with the code DAOSPEC (Stetson & Pancino 2008) through the wrapper 4DAO (Mucciarelli 2013). All the other abundances were derived by performing a χ2 minimisation, with our proprietary code SALVADOR, between the observed spectrum and the grids of synthetic spectra calculated with SYNTHE. One-dimensional, plane-parallel, local thermodynamic equilibrium (LTE) model atmospheres were calculated with the code ATLAS9 (Kurucz 2005).
Total uncertainties were estimated by adding in quadrature the main sources errors, namely the errors arising from the measurement process and those arising from the adopted stellar parameters. For the elements derived from EWs, the internal error was computed as the line-to-line scatter divided by the root mean square of the number of lines. For the elements derived from spectral synthesis, the uncertainty in the measure was estimated with Monte Carlo simulations using the same approach described in Sect. 3.
The effective temperature (Teff) and surface gravity (logg) of #25664 were estimated using the photometry of the early third data release (EDR3) of the European Space Agency/Gaia mission (Gaia Collaboration 2016, 2021). We used a new implementation of the (BP-RP)0-Teff transformation by Mucciarelli & Bellazzini (2020) based on the Gaia EDR3 photometry, adopting the colour excess E(B − V) = 0.12 mag (Harris 1996, 2010 edition) and correcting for the extinction following the procedure in Gaia Collaboration (2018). The associated error – based on the uncertainty of the photometry, the reddening, and the adopted colour-Teff calibration – is ~90 K. Surface gravity was computed by adopting the photometric Teff, a mass of 0.8 M⊙, and G-bandbolometric corrections computed according to Andrae et al. (2018). The microturbulent velocity was estimated using the standard approach to minimise the trend between the abundance of Fe and the reduced EW. We estimated Teff = 5116 ± 90 K, log g = 2.44 ± 0.1, and vt = 1.4 ± 0.1 km s−1.
The analysis of the UVES spectrum provides [Fe I/H] = –1.74 ± 0.09 dex and [Fe II/H] = –1.69 ± 0.05 dex, with an excellent match between the two measures of Fe abundances. The adopted Teff provides a negative slope (–0.03 ± 0.01 dex/eV) between iron abundances and excitation potential that can be minimised by decreasing Teff by about 200 K. This difference between spectroscopic and photometric Teff for metal-poor stars has already been discussed by Mucciarelli & Bonifacio (2020), who recommend using the photometric Teff values even if they introduce negative slopes with the excitation potential.
The atmospheric parameters adopted by Mucciarelli et al. (2019) were derived by adopting optical and near-infrared ground-based photometry and the colour-Teff transformations in Alonso et al. (1999); we obtained Teff = 4958 K and logg = 2.37. The Teff based on the Gaia EDR3 photometry and used in this work (Teff = 5116 K) is ~160 K hotter than that adopted by Mucciarelli et al. (2019). This difference mainly reflects the intrinsic difference between the two colour-Teff transformations. The difference in the two sets of parameters leads to a variation in [Fe I/H], which is mainly sensitive to Teff, but similar [Fe II/H] because the variation in [Fe II/H] due to Teff compensates for the variation due to log g (δ logg = +0.07). When the parameters by Mucciarelli et al. (2019) are adopted, we derive [Fe I/H] = –1.88 ± 0.09 dex and [Fe II/H] = –1.71 ± 0.05 dex. The Gaia/EDR3 Teff provides a better agreement between the two Fe abundances. On the other hand, the two sets of parameters lead to similar abundance ratios [X/Fe], with variations smaller than 0.05 dex.
Additionally, for the two comparison stars observed with X-shooter, the atmospheric parameters were re-derived using the Gaia EDR3 photometry; we found Teff = 5076 K and logg = 2.46 for the 1P star #77093 and Teff = 5104 K and logg = 2.49 for the 2P star #329049. For the sake of homogeneity, the [Fe/H] of the three stars was estimated from about ten unblended Fe I lines from the X-shooter spectra. For #25664, the [Fe/H] from UVES and X-shooter match well, within the uncertainties.
4.1 Lithium
The resonance Li line at 6707 Å is detected in each spectrum because of its huge EW (~230 mÅ). We derived the Li abundance from the UVES spectrum that allows both the resonance line and the subordinate line at 6103 Å (not visible in the other spectra due to its small strength) to be measured. Lithium abundances from these two lines have been corrected for non-local thermodynamic equilibrium (NLTE) effects according to Lind et al. (2009b).
The best fit of the resonance line in the UVES spectrum is not fully satisfactory, because at this spectral resolution we are not able to simultaneously reproduce the line depth and the line broadening, in particular the red wing of the line. These effects were not revealed with the GIRAFFE spectra, because of their lower spectral resolution. The lower panels of Fig. 3 show the observed line profile compared to a grid of synthetic spectra computed with two different 6Li∕7Li isotopic ratios, namely 0.0 and 0.08 (right and left panel, respectively). The assumption of no 6Li (instead of a solar 6Li∕7Li isotopic ratio) improves the quality of the fit, but again we cannot reproduce the entire line profile. We ascribe this effect to the use of one-dimensional model atmospheres that crudely describe the velocity fields in the stellar photospheres, with a relevant impact on strong and asymmetric lines, such as that at 6708 Å. The final Li abundance obtained by fitting the entire profile of the resonance Li line is  = +2.68 ± 0.10 dex, assuming no 6Li. That results in an intermediate value between the abundance obtained by fitting only the wings (
 = +2.60 dex) and that obtained by excludingthe red wing (
 = +2.74 dex). The quoted uncertainty is dominated by the uncertainties in Teff, while the other parameters have a null impact on the abundance, and the error in the fitting procedure (estimated according to Monte Carlo simulations) is only 0.01 dex because of the high S/N of the UVES spectrum and the intensity of the Li line.
The weak subordinate Li line at 6103 Å provides an NLTE abundance of  = +2.71 ± 0.08 dex (see the upper panel of Fig. 3). The error in the fitting procedure is ± 0.06 dex, higher than that estimated for the strong Li resonance line. On the other hand, this line has the advantages of being less sensitive to Teff with respect to the resonance line, of being insensitive to the assumed 6Li∕7Li isotopic ratio, and of having a milder sensitivity to NLTE effects (the NLTE correction is +0.08 dex for the subordinate line and –0.22 dex for the resonance line). For these reasons we decided to adopt the lithium abundance of the subordinate line. This value confirms the Li enhancement of this star without calling into question our previous conclusions.
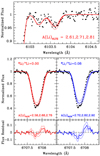 |
Fig. 3 Portions of the UVES spectrum (black squares) around the subordinate and resonance Li lines (the upper panel and the middle and lower panels, respectively). In the upper panel, the observed spectrum is superimposed onto the best-fit synthetic spectrum (thick red line) and two synthetic spectra calculated with |


4.2 Oxygen, sodium, magnesium, and aluminium
Here we discuss the chemical abundances for the light elements (O, Na, Mg, and Al) involved in the abundance patterns of GC stars.
The only available indicator of O abundance is the forbidden oxygen line at 6300 Å. Due to the relatively high Teff and the low metallicity of the star, the line is also very weak in the UVES spectrum despite its high S/N. Using synthetic spectra we can only provide an upper limit for the O abundance ([O/Fe] < +0.30 dex).
Mucciarelli et al. (2019) derived the Na abundance of #25664 from the Na D lines in order to compare its [Na/Fe] with those of the other LRGB stars in ω Centauri discussed in Mucciarelli et al. (2018). The UVES spectrum analysed here allows us to measure the Na doublets at 5682–88 Å and at 6154–6160 Å, which are usually adopted as indicators of Na abundance in giant stars. From these lines we found an NLTE abundance [Na/Fe] = +1.00 ± 0.05 dex, adopting the NLTE corrections by Lind et al. (2011). This abundance is 0.13 dex higher than the previous estimate based on Na D lines and the Alonso et al. (1999) Teff scale, confirming the extraordinary [Na/Fe] enhancement of this star.
From the X-shooter spectrum we derived abundances of Al and Mg for the Li- and Na-rich star and the two comparison stars. The Al abundance cannot be inferred from the UVES spectrum because the Al doublet at 6696–98 Å is too weak, while the X-shooter spectra sample the resonance Al line at 3961 Å. Additionally, we can measure the Mg b triplet at 5165–5185 Å for the three X-shooter targets. The Mg abundances in #25664 derived using different lines in the UVES and X-shooter spectra are in excellent agreement. Figure 4 shows the behaviour of [Al/Fe] as a function of [Mg/Fe] for these three targets. The three stars are located in different parts of the [Mg/Fe]-[Al/Fe] diagram, with the [Mg/Fe] of #25664 similar to that of the 1P star but the [Al/Fe] in between those measured in the two reference stars.
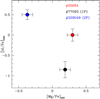 |
Fig. 4 Behaviour of [Al/Fe] as a function of [Mg/Fe] derived from the X-shooter spectra for #25664 and the two comparison stars. |
4.3 C, N, and 12C/13C
C and N abundances were derived from the comparison between synthetic spectra and the flux-calibrated X-shooter and UVES spectra. C abundances were obtained by fitting the CH G-band (A2Δ − X2Π) at ~4300 Å, employing the most recent line list by Masseron et al. (2014). N abundances were derived using the NH (A3 Πi − X3Σ−) molecular band at ~3360 Å; additionally, we also derived N abundances from the CN (B2Σ − X2Σ) molecular band at 3880 Å (for both molecules, we adopted the line lists available in the R. L. Kurucz database). The two N diagnostics provide different results (see e.g. Spite et al. 2005), but we privileged the NH band because it is a ‘pure’ indicator of the N abundances, while the CN band is also sensitive to the C abundance. For the CN band, we derived the N abundances by fixing the C abundance obtained from the CH band.
We preferred to use the flux-calibrated spectra in order to reduce problems related to the spectral normalisation, which can be a critical issue in heavily blanketed regions. For each wavelength the flux was corrected for the reddening by adopting the extinction law from Savage & Mathis (1979) and a colour excess E(B − V) = 0.12 mag (Harris 1996, 2010 edition). The de-reddened flux-calibrated spectra were then compared with synthetic spectra. In this way, weneeded only to apply a scaling factor to match observed and synthetic spectra, avoiding the risk of distorting the real shape of the observed spectrum with a potentially significant impact on the derived C and N abundances.The C and N abundances of #25664 derived from X-shooter and UVES spectra are in excellent agreement. In the following we refer to the C and N abundances from X-shooter to compare the abundances of #25664 with those of the two reference stars observed with X-shooter.
Star #25664 is enhanced both in C and in N abundances (the latter regardless of the diagnostic, with the CN band that provides N abundances higher than the NH band by ~0.4–0.5 dex). The two comparison stars show different patterns, as expected: The C abundances in the two stars are similar, with a slightly lower C abundance in the 2P star. The 2P star exhibits a strong enhancement in N with respect to the 1P star. When we compare #25664 with these two stars we find that it has a [N/Fe] compatible with that of the 2P star, while its [C/Fe] is higher than those of both stars.
The comparison between the NH, CN, and CH bands in these three stars is displayed in Fig. 5. It shows both the similar N abundance in #25664 and the 2P reference star and the higher C abundance of #25664 with respect to the two reference stars.
Adopting the C abundance obtained with the X-shooter spectrum, we measured the 12C ∕13C isotopic ratio from about ten 13CH features in the UVES blue arm flux-calibrated spectrum, finding an average value of 15 ± 2. Giant stars affected by additional mixing after the first dredge-up have 12C ∕13C values of around 5–6, while metal-poor LRGB stars have values higher than 13–15 (see e.g. Spite et al. 2006). The value measured in #25664 indicates that this star has not yet undergone the extra-mixing episode usually associated with the RGB bump.
Chemical abundances of #25664 from the UVES spectrum.
Chemical abundances of #25664 and of the comparison stars, #77093 and #320949, from the X-shooter spectra.
4.4 Potassium
Two GCs, namely NGC 2419 and NGC 2808, exhibit intrinsic scatter in their potassium abundances (Mucciarelli et al. 2012b, 2015; Cohen & Kirby 2012). The enhancement in [K/Fe] is coupled with a significant depletion in [Mg/Fe], defining a clear Mg-K anti-correlation. In other GCs, K abundances have only small or null [K/Fe] spreads (Carretta et al. 2013; Mucciarelli et al. 2017; Černiauskas et al. 2017, 2018).
We derived potassium abundances in the three X-shooter spectra from the resonance line at 7699 Å. This transition suffers from significant NLTE corrections. The three stars have similar stellar parameters, metallicity, and LTE K abundance, and therefore they should have the same NLTE correction for the K resonance line. In accordance with the NLTE calculations presented by Mucciarelli et al. (2017), we applied an offset of –0.35 dex to the K abundances of the three stars. No significant difference inthe K abundances is found.
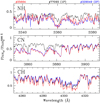 |
Fig. 5 Comparison between the X-shooter spectra of #25664 (red line) and the two reference stars (black line for 1P and blue line for 2P) for the NH (upper panel), CN (middle panel), and CH (lower panel) molecular bands. The flux-reduced spectra are corrected for extinction and normalised to the flux measured at 5260 Å. |
5 Discussion
Our multi-instrument spectroscopic analysis of the peculiar LRGB star #25664 of ω Centauri provides the following results:
We confirm that the star is characterised by an extraordinary high abundance of both Li and Na, providing abundances based on diagnostics less sensitive to the 6Li∕7Li isotopic ratio, NLTE, and/or 3D effects with respect to those used by Mucciarelli et al. (2019). Once the effect of the first dredge-up is accounted for, the initial A(Li) of this star is predicted to be around 4.0 dex.
The RVs measured in different epochs reveal the RV variability of this star, suggesting that it could be a member of a binary system.
The star has not yet experienced the extra-mixing process that occurs at the RGB bump luminosity level, as demonstrated by the measured 12C∕13C isotopic ratio.
Star #25664 is enriched in both [C/Fe] and [N/Fe]. The [N/Fe] is compatible with the value measured in the 2P comparison star, while the [C/Fe] is higher than both the 1P and 2P comparison stars.
The star has enhanced [Mg/Fe] and [Al/Fe] abundance ratios. The latter, in particular, turns out to be intermediate between the Al abundances of the 1P and 2P reference stars.
The other chemical species measured here do not show oddities, indicating that the star is enhanced in [α/Fe] abundance ratios (Si, Ca, Ti), similar to the other stars of ω Centauri that have similar metallicities (see e.g. Johnson & Pilachowski 2010).
This analysis confirms the uniqueness of star #25664, which is distinct from the other Li-rich GC stars known to date, not only for its over-abundances of Li and Na but also for its peculiar combination of high C and N abundances. In terms of C and N, #25664 does not resemble either the 1P or the 2P reference stars that we measured. In fact, among the GC stars we would expect a more or less pronounced C-N anti-correlation or at least a large spread in N abundance at almost constant C abundance (see e.g. Lardo et al. 2012, 2013; Yong et al. 2015; Hollyhead et al. 2017); we observe the latter case for the two reference stars. Even if the complex chemical patterns of ω Centauri in terms of C and N abundances cannot be captured by these two reference stars only, this comparison reveals that #25664 has been enriched in C and N in an anomalous way compared to what we expect, that is, similar or lower C abundances in stars with enhanced N abundances.
In one of the possible scenarios discussed by Mucciarelli et al. (2019), the circulation due to the onset of extra-mixing processes (in addition to convection) after the RGB bump should be able to move 3He from the convective envelope down to regions hot enough to form 7Be, which must be transported back to the envelope to form 7Li (see Denissenkov & VandenBerg 2003). The 12C∕13C isotopic ratio of #25664 (15 ± 2) is consistentwith the values measured in pre-RGB bump stars. This shows that #25664 has not yet experienced the extra-mixing episode that occurs at the RGB bump because mixed stars usually have 12C ∕13C around 5-6, and in general well below 10 (Gratton et al. 2000; Spite et al. 2006). Therefore, this scenario of internal Li production can be ruled out.
Two other viable scenarios can be envisaged to explain the anomalous chemical pattern of #25664, namely a mass transfer process within a binary system or the formation of this star from the pure ejecta of super-AGB stars. In the first case, #25664 could be a member of a binary system with a companion star that is now a faint compact object, most likely a white dwarf. This scenario is favoured by the RV variability detected with our multi-epoch spectroscopic dataset. During its main sequence evolution, #25664 could have experienced mass accretion from the companion’s progenitor, and the accreted gas must have then been diluted in its convective envelope to a degree that depends on the exact value of the initial mass of #25664, the timing, and the amount of accreted gas.
In accordance with the theoretical models for the AGB ejecta (Ventura et al. 2013; Doherty et al. 2014), we identify two potential candidates for the companion star’s progenitor, namely AGB stars with 3–4 and 7–8 M⊙, because their winds are predicted to contain high abundances of Li and Na. However, in order to properly compare the measured abundances with the predicted values, appropriate models for the evolution of the binary system that account for the efficiency, the timing, and the duration of the accretion should be computed.
At our request, Pasquale Panuzzo (GEPI, France) conducted a Bayesian analysis of the RV measurements. The analysis displays peaks in the posterior probability distribution of periods at around 550, 770, and 1130 days, the last being the maximum peak. A unique determination of the period would require further observations with a better coverage of orbital phases.
The second, fascinating scenario to explain #25664 was proposed by Mucciarelli et al. (2019), who suggested that this star formed directly from the pure ejecta of a super-AGB star before the dilution with the pristine gas (D’Antona et al. 2012). The existence in some clusters of a small fraction of stars formed through this process has mainly been proposed to explain the He-rich (Y ~ 0.35) stellar population in some clusters, including Omega Centauri.
The new chemical and kinematical data presented in this work should motivate further attempts to explain the peculiar surface chemistry of #25664, which does not resemble any other GC star observed so far and remains a unicum among GC stars. New RV measures, performed with a suitable time sampling, are needed to firmly confirm or reject the binary scenario. For both scenarios, new, dedicated theoretical models are needed in order to properly reproduce the entire chemical composition of #25664.
Acknowledgements
We thank the referee, Franca D’Antona, for the useful comments and suggestions. We are extremely grateful to Pasquale Panuzzo for analysing our radial velocity data with his bayesian code Batman. This work has made use of data from the European Space Agency (ESA) mission Gaia (https://www.cosmos.esa.int/gaia), processed by the Gaia Data Processing and Analysis Consortium (DPAC, https://www.cosmos.esa.int/web/gaia/dpac/consortium). Funding for the DPAC has been provided by national institutions, in particular the institutions participating in the Gaia Multilateral Agreement.
References
- Aguilera-Gómez, C., Chanamé, J., Pinsonneault, M. H., et al. 2016, ApJ, 833, L24 [NASA ADS] [CrossRef] [Google Scholar]
- Aguilera-Gómez, C., Chanamé, J., & Pinsonneault, M. H. 2020, ApJ, 897, L20 [CrossRef] [Google Scholar]
- Alonso, A., Arribas, S., & Martínez-Roger, C. 1999, A&AS, 140, 261 [NASA ADS] [CrossRef] [EDP Sciences] [Google Scholar]
- Andrae, R., Fouesneau, M., Creevey, O., et al. 2018, A&A, 616, A8 [NASA ADS] [CrossRef] [EDP Sciences] [Google Scholar]
- Bastian, N., & Lardo, C. 2018, ARA&A, 56, 83 [Google Scholar]
- Bellini, A., Piotto, G., Bedin, L. R., et al. 2009, A&A, 493, 959 [NASA ADS] [CrossRef] [EDP Sciences] [Google Scholar]
- Bertaux, J. L., Lallement, R., Ferron, S., et al. 2014, A&A, 564, A46 [NASA ADS] [CrossRef] [EDP Sciences] [Google Scholar]
- Bonifacio, P., & Molaro, P. 1997, MNRAS, 285, 847 [NASA ADS] [CrossRef] [Google Scholar]
- Boothroyd, A. I., & Sackmann, I.-J. 1999, ApJ, 510, 232 [NASA ADS] [CrossRef] [Google Scholar]
- Boothroyd, A. I., Sackmann, I.-J., & Wasserburg, G. J. 1995, ApJ, 442, L21 [NASA ADS] [CrossRef] [Google Scholar]
- Caffau, E., Ludwig, H.-G., Steffen, M., et al. 2011, Sol. Phys., 268, 255 [NASA ADS] [CrossRef] [Google Scholar]
- Cameron, A. G. W., & Fowler, W. A. 1971, ApJ, 164, 111 [NASA ADS] [CrossRef] [Google Scholar]
- Carretta, E., Gratton, R. G., Bragaglia, A., et al. 2013, ApJ, 769, 40 [NASA ADS] [CrossRef] [Google Scholar]
- Casey, A. R., Ruchti, G., Masseron, T., et al. 2016, MNRAS, 461, 3336 [NASA ADS] [CrossRef] [Google Scholar]
- Casey, A. R., Ho, A. Y. Q., Ness, M., et al. 2019, ApJ, 880, 125 [Google Scholar]
- Černiauskas, A., Kučinskas, A., Klevas, J., et al. 2017, A&A, 604, A35 [NASA ADS] [CrossRef] [EDP Sciences] [Google Scholar]
- Černiauskas, A., Kučinskas, A., Klevas, J., et al. 2018, A&A, 615, A173 [NASA ADS] [CrossRef] [EDP Sciences] [Google Scholar]
- Charbonnel, C., & Zahn, J.-P. 2007, A&A, 476, L29 [NASA ADS] [CrossRef] [EDP Sciences] [Google Scholar]
- Cohen, J. G., & Kirby, E. N. 2012, ApJ, 760, 86 [NASA ADS] [CrossRef] [Google Scholar]
- D’Antona, F., D’Ercole, A., Carini, R., et al. 2012, MNRAS, 426, 1710 [NASA ADS] [CrossRef] [Google Scholar]
- Dekker, H., D’Odorico, S., Kaufer, A., Delabre, B., & Kotzlowski, H. 2000, SPIE, 4008, 534 [Google Scholar]
- Denissenkov, P. A., & VandenBerg, D. A. 2003, ApJ, 593, 509 [NASA ADS] [CrossRef] [Google Scholar]
- D’Ercole, A., D’Antona, F., Carini, R., et al. 2012, MNRAS, 423, 1521 [NASA ADS] [CrossRef] [Google Scholar]
- Dobrovolskas, V., Kucinskas, A., Bonifacio, P., et al. 2014, A&A, 565, A121 [NASA ADS] [CrossRef] [EDP Sciences] [Google Scholar]
- Doherty, C. L., Gil-Pons, P., Lau, H. H. B., et al. 2014, MNRAS, 441, 582 [NASA ADS] [CrossRef] [Google Scholar]
- Gaia Collaboration (Prusti, T., et al.) 2016, A&A, 595, A1 [NASA ADS] [CrossRef] [EDP Sciences] [Google Scholar]
- Gaia Collaboration (Babusiaux C., et al.) 2018, A&A, 616, A10 [NASA ADS] [CrossRef] [EDP Sciences] [Google Scholar]
- Gaia Collaboration (Brown, A. G. A., et al.) 2021, A&A, 649, A1 [NASA ADS] [CrossRef] [EDP Sciences] [Google Scholar]
- González Hernández, J. I., Bonifacio, P., Caffau, E., et al. 2009, A&A, 505, L13 [NASA ADS] [CrossRef] [EDP Sciences] [Google Scholar]
- Gratton, R. G., Sneden, C., Carretta, E., et al. 2000, A&A, 354, 169 [NASA ADS] [Google Scholar]
- Gratton, R., Bragaglia, A., Carretta, E., et al. 2019, A&ARv, 27, 8 [Google Scholar]
- Grevesse, N., & Sauval, A. J. 1998, Space Sci. Rev., 85, 161 [Google Scholar]
- Harris, W. E. 1996, AJ, 112, 1487 [NASA ADS] [CrossRef] [Google Scholar]
- Hollyhead, K., Kacharov, N., Lardo, C., et al. 2017, MNRAS, 465, L39 [NASA ADS] [CrossRef] [Google Scholar]
- Johnson, C. I., & Pilachowski, C. A. 2010, ApJ, 722, 1373 [Google Scholar]
- Johnson, J. A., Aller, K. M., Howard, A. W., et al. 2010, PASP, 122, 905 [NASA ADS] [CrossRef] [Google Scholar]
- Kumar, Y. B., Reddy, B. E., Campbell, S. W., et al. 2020, Nat. Astron., 4, 1059 [CrossRef] [Google Scholar]
- Kurucz, R. L. 2005, MSAIS, 8, 14 [NASA ADS] [Google Scholar]
- Lardo, C., Milone, A. P., Marino, A. F., et al. 2012, A&A, 541, A141 [NASA ADS] [CrossRef] [EDP Sciences] [Google Scholar]
- Lardo, C., Pancino, E., Mucciarelli, A., et al. 2013, MNRAS, 433, 1941 [NASA ADS] [CrossRef] [Google Scholar]
- Lind, K., Primas, F., Charbonnel, C., Grundahl, F., & Asplund, M. 2009a, A&A, 503, 545 [NASA ADS] [CrossRef] [EDP Sciences] [MathSciNet] [Google Scholar]
- Lind, K., Asplund, M., & Barklem, P. S. 2009b, A&A, 503, 541 [NASA ADS] [CrossRef] [EDP Sciences] [Google Scholar]
- Lind, K., Asplund, M., Barklem, P. S., & Belyaev, A. K. 2011, A&A, 528, A103 [NASA ADS] [CrossRef] [EDP Sciences] [Google Scholar]
- Marino, A. F., Milone, A. P., Piotto, G., et al. 2011, ApJ, 731, 64 [Google Scholar]
- Marino, A. F., Milone, A. P., Piotto, G., et al. 2012, ApJ, 746, 14 [NASA ADS] [CrossRef] [Google Scholar]
- Masseron, T., Plez, B., Van Eck, S., et al. 2014, A&A, 571, A47 [NASA ADS] [CrossRef] [EDP Sciences] [Google Scholar]
- Mayor, M., Pepe, F., Queloz, D., et al. 2003, The Messenger, 114, 20 [NASA ADS] [Google Scholar]
- Momany, Y., Zaggia, S., Montalto, M., et al. 2020, Nat. Astron., 4, 1092 [Google Scholar]
- Monaco, L., Villanova, S., Bonifacio, P., et al. Ludwig, H.-G. 2012, A&A, 539, A157 [NASA ADS] [CrossRef] [EDP Sciences] [Google Scholar]
- Monaco, L., Boffin, H. M. J., Bonifacio, P., et al. 2014, A&A, 564, L6 [NASA ADS] [CrossRef] [EDP Sciences] [Google Scholar]
- Mucciarelli, A. 2013, ArXiv eprints [arXiv:1311.1403] [Google Scholar]
- Mucciarelli, A., & Bonifacio, P. 2020, A&A, 640, A87 [CrossRef] [EDP Sciences] [Google Scholar]
- Mucciarelli, A., & Bellazzini, M. 2020, Res. Notes Am. Astron. Soc., 4, 52 [CrossRef] [Google Scholar]
- Mucciarelli, A., Salaris, M., & Bonifacio, P. 2012a, MNRAS, 419, 2195 [NASA ADS] [CrossRef] [Google Scholar]
- Mucciarelli, A., Bellazzini, M., Ibata, R., et al. 2012b, MNRAS, 426, 2889 [NASA ADS] [CrossRef] [Google Scholar]
- Mucciarelli, A., Pancino, E., Lovisi, L., et al. 2013, ApJ, 766, 78 [NASA ADS] [CrossRef] [Google Scholar]
- Mucciarelli, A., Bellazzini, M., Merle, T., et al. 2015, ApJ, 801, 68 [NASA ADS] [CrossRef] [Google Scholar]
- Mucciarelli, A., Merle, T., & Bellazzini, M. 2017, A&A, 600, A104 [NASA ADS] [CrossRef] [EDP Sciences] [Google Scholar]
- Mucciarelli, A., Salaris, M., Monaco, L., et al. 2018, A&A, 618, A134 [NASA ADS] [CrossRef] [EDP Sciences] [Google Scholar]
- Mucciarelli, A., Monaco, L., Bonifacio, P., et al. 2019, A&A, 623, A55 [CrossRef] [EDP Sciences] [Google Scholar]
- Pasquini, L., Avila, G., Blecha, A., et al. 2002, The Messenger, 110, 1 [Google Scholar]
- Pasquini, L., Bonifacio, P., Molaro, P., et al. 2005, A&A, 441, 549 [NASA ADS] [CrossRef] [EDP Sciences] [Google Scholar]
- Rebolo, R., Molaro, P., & Beckman, J. E. 1988, A&A, 192, 192 [NASA ADS] [Google Scholar]
- Sanna, N., Franciosini, E., Pancino, E., et al. 2020, A&A, 639, L2 [NASA ADS] [CrossRef] [EDP Sciences] [Google Scholar]
- Savage, B. D.,& Mathis, J. S. 1979, ARA&A, 17, 73 [NASA ADS] [CrossRef] [Google Scholar]
- Sbordone, L., Bonifacio, P., Castelli, F. & Kurucz, R. L. 2004, MSAIS, 5, 93 [Google Scholar]
- Siess, L., & Livio, M. 1999, MNRAS, 308, 1133 [NASA ADS] [CrossRef] [Google Scholar]
- Spite, F., & Spite, M. 1982, A&A, 115, 357 [NASA ADS] [Google Scholar]
- Spite, M., Cayrel, R., Plez, B., et al. 2005, A&A, 430, 655 [NASA ADS] [CrossRef] [EDP Sciences] [Google Scholar]
- Spite, M., Cayrel, R., Hill, V., et al. 2006, A&A, 455, 291 [NASA ADS] [CrossRef] [EDP Sciences] [Google Scholar]
- Stetson, P. B., & Pancino, E. 2008, PASP, 120, 1332 [Google Scholar]
- Ventura, P., & D’Antona, F. 2011, MNRAS, 410, 2760 [Google Scholar]
- Ventura, P., Di Criscienzo, M., Carini, R., et al. 2013, MNRAS, 431, 3642 [NASA ADS] [CrossRef] [Google Scholar]
- Vernet, J., Dekker, H., D’Odorico, S., et al. 2011, A&A, 536, A105 [NASA ADS] [CrossRef] [EDP Sciences] [Google Scholar]
- Yong, D., Grundahl, F., & Norris, J. E. 2015, MNRAS, 446, 3319 [NASA ADS] [CrossRef] [Google Scholar]
A(Li) =  .
.
IRAF (Image Reduction and Analysis Facility) is distributed by the National Optical Astronomy Observatory, which is operated by the Association of Universities for Research in Astronomy (AURA) under a cooperative agreement with the National Science Foundation.
All Tables
Chemical abundances of #25664 and of the comparison stars, #77093 and #320949, from the X-shooter spectra.
All Figures
|
Fig. 1 Behaviour of heliocentric RVs as a function of the modified Julian date derived from the multi-instrument spectroscopic datasets listed in Table 1. Errors on RVs are smaller than the symbols. |
| In the text | |
|
Fig. 2 Comparison between two HARPS spectra. Upper panels: portions of the HARPS spectra around some photospheric lines acquired in 2019 February (black line) and 2021 January (red line). The two spectra are corrected for the corresponding heliocentric correction. Lower panel: portions of the same HARPS spectra around telluric lines, without applying the heliocentric correction. |
| In the text | |
|
Fig. 3 Portions of the UVES spectrum (black squares) around the subordinate and resonance Li lines (the upper panel and the middle and lower panels, respectively). In the upper panel, the observed spectrum is superimposed onto the best-fit synthetic spectrum (thick red line) and two synthetic spectra calculated with |
| In the text | |
|
Fig. 4 Behaviour of [Al/Fe] as a function of [Mg/Fe] derived from the X-shooter spectra for #25664 and the two comparison stars. |
| In the text | |
|
Fig. 5 Comparison between the X-shooter spectra of #25664 (red line) and the two reference stars (black line for 1P and blue line for 2P) for the NH (upper panel), CN (middle panel), and CH (lower panel) molecular bands. The flux-reduced spectra are corrected for extinction and normalised to the flux measured at 5260 Å. |
| In the text | |
Current usage metrics show cumulative count of Article Views (full-text article views including HTML views, PDF and ePub downloads, according to the available data) and Abstracts Views on Vision4Press platform.
Data correspond to usage on the plateform after 2015. The current usage metrics is available 48-96 hours after online publication and is updated daily on week days.
Initial download of the metrics may take a while.