| Issue |
A&A
Volume 652, August 2021
|
|
|---|---|---|
| Article Number | L12 | |
| Number of page(s) | 9 | |
| Section | Letters to the Editor | |
| DOI | https://doi.org/10.1051/0004-6361/202140698 | |
| Published online | 25 August 2021 | |
Letter to the Editor
Detection of interstellar H2CCCHC3N
A possible link between chains and rings in cold cores
1
Department of Physics and Astronomy, Benedictine College, Atchison, KS 66002, USA
e-mail: cshingledecker@benedictine.edu
2
Zentrum für astrochemische Studien, Max Planck-Institut für extraterrestrische Physik, Garching bei München, Germany
3
Institute for Theoretical Chemistry, Universität Stuttgart, Stuttgart, Germany
4
Department of Chemistry, Massachusetts Institute of Technology, Cambridge, MA 02139, USA
e-mail: bmcguire@mit.edu
5
Dipartimento di Chimica, Biologia e Biotecnologie, Universitá degli Studi di Perugia, 06123 Perugia, Italy
6
Center for Astrophysics | Harvard & Smithsonian, Cambridge, MA 02138, USA
7
Astrochemistry Laboratory and the Goddard Center for Astrobiology, NASA Goddard Space Flight Center, Greenbelt, MD 20771, USA
8
National Radio Astronomy Observatory, Charlottesville, VA 22903, USA
9
Department of Astronomy, University of Virginia, Charlottesville, VA 22904, USA
Received:
2
March
2021
Accepted:
7
May
2021
Context. The chemical pathways linking the small organic molecules commonly observed in molecular clouds to the large, complex, polycyclic species long suspected of being carriers of the ubiquitous unidentified infrared emission bands remain unclear.
Aims. To investigate whether the formation of mono- and polycyclic molecules observed in cold cores could form via the bottom-up reaction of ubiquitous carbon-chain species with, for example, atomic hydrogen, a search is made for possible intermediates in data taken as part of the GOTHAM (GBT Observations of TMC-1: Hunting for Aromatic Molecules) project.
Methods. Markov chain Monte Carlo (MCMC) source models were run to obtain column densities and excitation temperatures. Astrochemical models were run to examine possible formation routes, including (a) a novel grain-surface pathway involving the hydrogenation of C6N and HC6N, (b) purely gas-phase reactions between C3N and both propyne (CH3CCH) and allene (CH2CCH2), and (c) via the reaction CN + H2CCCHCCH.
Results. We report the first detection of cyanoacetyleneallene (H2CCCHC3N) in space toward the TMC-1 cold cloud using the Robert C. Byrd 100 m Green Bank Telescope. Cyanoacetyleneallene may represent an intermediate between less-saturated carbon chains, such as the cyanopolyynes, that are characteristic of cold cores and the more recently discovered cyclic species, such as cyanocyclopentadiene. Results from our models show that the gas-phase allene-based formation route in particular produces abundances of H2CCCHC3N that match the column density of 2 × 1011 cm−2 obtained from the MCMC source model, and that the grain-surface route yields large abundances on ices that could potentially be important as precursors for cyclic molecules.
Key words: astrochemistry / molecular processes / ISM: molecules / ISM: individual objects: TMC-1
© ESO 2021
1. Introduction
Highly unsaturated linear carbon-chain molecules – such as the cyanopolyynes HC3N (Turner 1971), HC5N (Avery et al. 1976; Broten et al. 1976), HC7N (Kroto et al. 1978; Little et al. 1978; Winnewisser & Walmsley 1978), HC9N (Broten et al. 1978), and, most recently, HC11N (Loomis et al. 2021) – have long been known components of interstellar clouds and characteristic products of the unique gas-phase chemistry that occurs in those regions. A much more recent development has been the definitive detection of cyclic aromatic molecules – such as benzonitrile (McGuire et al. 2018) and cyanocyclopentadiene (McCarthy et al. 2020) – even in cold cores such as TMC-1. The presence of these kinds of cyclic aromatic molecules is intriguing, in part because it is as yet unclear whether they form via a top-down mechanism from larger polycyclic species formed in circumstellar envelopes or via bottom-up pathways from small precursors.
If interstellar cyclic and polycyclic species can indeed form via a bottom-up route, then there may exist a direct chemical link to carbon-chain molecules such as the cyanopolyynes. In a previous work (Loomis et al. 2016) we noted that for very unsaturated linear molecules with more than ∼10−11 carbon atoms the cyclic form can be more energetically stable and, thus, that such long carbon chains might naturally tend to form rings at or above that size. Here, we envision a somewhat different mechanism in which shorter carbon chains (in this case consisting of a six-carbon-atom backbone) could hypothetically achieve aromaticity through a series of exothermic H-additions on grain surfaces, which would gradually break the linearity of the molecule and allow for eventual cyclization.
If grain-surface H-addition to highly unsaturated molecules such as cyanopolyynes were indeed a mechanism for forming aromatic species, then in principle one would expect a fraction of the intermediate association products to desorb into the gas phase, where they could be observed. Such intermediates would be more highly saturated than, for example, the cyanopolyynes but possess fewer H-atoms than the (poly)cyclic form.
In this work we report the first detection of cyanoacetyleneallene, H2C=C=CHC≡CC≡N, (IUPAC name 4,5-hexadien-2-ynenitrile, SMILES C=C=CC#CC#N) in the cold core TMC-1. This species, recently analyzed in the laboratory by McCarthy et al. (2020), could plausibly represent such a chemical “missing link”. The first detection of the unsubstituted form of this molecule, allenyl acetylene (H2CCCHCCH), also in TMC-1, has recently been reported by Cernicharo et al. (2021b); they also detected a number of new interstellar species in that source using data taken with the Yebes 40 m radio telescope (Cernicharo et al. 2021a,c; Marcelino et al. 2021; Cabezas et al. 2021; Agundez et al. 2021), thereby allowing for further examinations of their abundances and potential chemical connections.
The rest of this paper is organized as follows. Section 2 describes our observations, in Sect. 3 we summarize our method of analysis, an overview of our astrochemical modeling is given in Sect. 4, and, finally, in Sect. 5 we present the main conclusions of this work.
2. Observations
Details of the observing strategy for these observations have been presented elsewhere (McGuire et al. 2020, 2018) and will only be summarized here. The spectral line survey data analyzed here were taken as part of the GOTHAM (GBT Observations of TMC-1: Hunting Aromatic Molecules) project using the 100 m Robert C. Byrd Green Bank Telescope (GBT; McGuire et al. 2020). The full data set used includes observations from GBT projects GBT17A-164, GBT17A-434, GBT18A-333, and GBT18B-007 as well as data from project GBT19A-047 acquired through 2020 June. The pointing center for the observations was the cyanopolyyne peak of TMC-1 at (J2000) α = 04h41m42.50sδ = +25°41′26.8″. Pointing accuracy was confirmed every 1–2 h using the nearby calibrator source J0530+1331; typical pointing convergence was ≲5″. All observations were taken in switching mode, with a 1° throw to an off position verified to contain no emission. The spectra were flux calibrated using an internal noise diode and through complementary Karl G. Jansky Very Large Array (VLA) observations of the flux-calibrator source J0530+1331 (McGuire et al. 2020); the flux uncertainty is expected to be ∼20%.
3. Analysis techniques and results
Details of the data analysis techniques, specifically the procedures for spectral stacking and matched filtering, are presented in Loomis et al. (2021), and we only briefly discuss the relevant parts here. With a catalog of precise rest frequencies for cyanoacetyleneallene, we performed an initial search for the strongest transitions from a nominal 8 K simulation within the coverage of our data release 2 (DR2) data, with no individual transitions observable above an appreciable signal-to-noise ratio (S/N; 5σ). We subsequently performed a velocity stack, whereby we calculated a noise- and intensity-weighted average based on chunks of spectra centered at each catalog frequency, combining the flux spread across many thousands of spectral channels.
To improve the S/N of this velocity stack, we then carried out an independent forward modeling of the molecular flux using Markov chain Monte Carlo (MCMC) source models with a set of physical parameters based on prior work; this comprises the column density (Ncol, cm−2), the source size, and the radial velocity (VLSR; in km s−1) of four velocity components (Dobashi et al. 2018, 2019; McGuire et al. 2020) as well as a shared excitation temperature (Tex, K) and Gaussian line width (dv, km s−1). The source size was used to calculate a beam dilution factor that modifies the simulated flux based on how well the spatial extent of the source matches with the GBT beam. For computational efficiency, we selected transitions from the catalog within 1% of the largest predicted intensity: This corresponds to a total of 857 transitions used for our analysis, spanning the frequency range of our observational data. The described procedures are built into the MOLSIM package (Lee et al. 2021a), which performs the spectral simulation and wraps the affine-invariant MCMC implementation of EMCEE (Foreman-Mackey et al. 2013) and posterior analysis routines from ARVIZ (Kumar et al. 2019).
The MCMC sampling was subsequently used to condition the simulations by evaluating the likelihood of any given set of parameters (which constitute a model), guided by a set of prior distributions. As the choice of prior is often a topic of intense scrutiny in Bayesian approaches, we explored the choice of prior as part of our analysis. For molecules with individual observable transitions, we used weakly informative uniform priors to guide sampling: The resulting posterior was bootstrapped and used as a prior for the MCMC sampling of molecules without observable transitions. The choice of which molecule to use as a “template” was typically motivated by chemical similarity, assuming the molecules have similar chemical origins (i.e., shared pathways) and physical conditions.
To assess the sensitivity of our models to the choice of prior, we performed the MCMC sampling using HC9N and benzonitrile posteriors as prior distributions for cyanoacetyleneallene; we refer to the posterior means of these cases as Source Models A and B for later discussion. From our previous work (Loomis et al. 2021) we have found that the column densities are often highly covariant with the source size due to beam dilution; in this work we left the source sizes fixed to their respective prior mean values as a means to improve sampling convergence, for a total of ten free parameters. The simulated spectra were subsequently velocity stacked and cross-correlated with the observational velocity stack to determine a matched filter response, which represents a lower bound on the significance of our detection. As with other GOTHAM detections, we adopted a 5σ cutoff for the significance criterion to claim a detection (Loomis et al. 2021; Lee et al. 2021b). Finally, to ensure that the MCMC models are not artificially overestimating the matched filter response, we tested a third case, Source Model C, whereby we used the posterior parameters of benzonitrile to perform the spectral simulation without further sampling or optimization. These results are shown in Fig. 1, and a more complete set of MCMC results, including corner plots, can be found in the appendix.
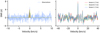 |
Fig. 1. Evidence for the detection of allenyl acetylene. Left: velocity stack of the observations (blue) and the two MCMC models. Right: matched filter responses of the three models considered; see text for details. |
The left panel of Fig. 1 shows the velocity stack of the observations and of the simulations that use the posterior means of Source Models A and B: Both models are able to reproduce the observed spectra faithfully, albeit with very different posterior parameters. Source Model A, which uses HC9N as its prior, corresponds to a larger derived column density (combined 9 × 1013 cm−2) and an extremely low excitation temperature of 2.8 K, close to the cosmic microwave background (CMB) temperature (Fixsen 2009), while Source Model B corresponds to a more typical column density (combined 2 × 1011 cm−2) and excitation temperature (8.5 K) relative to similar molecules recently detected toward TMC-1 (Lee et al. 2021b).
In the right panel of Fig. 1 are the matched filter spectra, which are the cross-correlation of the observational and simulated velocity stacks. The peak impulse response can be interpreted as a lower bound to the detection significance; however, given that each model produces a similar impulse response, we were unable to rely on this metric for model selection. Despite being physically nonintuitive, Source Model A results in the largest peak impulse response, while Source Model B only marginally improves the S/N from the baseline Source Model C despite being conditioned on the observations. The problem of which model to base assumptions on is one of model selection and would require a means to calculate the full Bayesian evidence by integration over model space: This is not readily tractable given the complexity of our model. Thus, while we are unable to definitively provide estimates of the modeling parameters, the significant impulse response attained even by the un-optimized fiducial Source Model C provides strong evidence for the velocity-stacked detection of cyanoacetyleneallene toward TMC-1 at ≥7σ.
While we are unable to quantitatively rule out each source model with the matched filter response, we can provide qualitative arguments based on similarities to other detected molecules in TMC-1, particularly in terms of the derived column density. Thus far, molecules comprising five to seven heavy atoms, for example the [H3C5N] family (Lee et al. 2021b) and c-C5H5CN (Lee et al. 2021b; McCarthy et al. 2021), have all been detected with column densities of approximately ∼1011 cm−2. The molecule we report the detection of in this work, cyanoacetyleneallene, corresponds to the -CN derivative of allenyl acetylene, a molecule recently detected by Cernicharo et al. (2021c): If we assume these molecules are related via the straightforward radical addition of CN, as shown in reaction (R8) in Sect. 4, then we can compare their column density ratios with other hydrocarbon-CN pairs with similar bond structure detected in TMC-1. Because the allenyl acetylene was detected with observations at higher frequencies (34–50 GHz) compared to the GOTHAM survey, direct abundance comparisons should be taken with a degree of caution as they can be highly degenerate with the assumed or fitted source size. Cernicharo et al. (2021b) assumed a source size radius of 40″ for allenyl acetylene, while the derived full width at half maximum source sizes of the individual velocity components for cyanoacetyleneallene here ranged from 70–259″ for Source Model B. Nevertheless, as shown in Table 1, the hydrocarbon to CN derivative ratio ranges from 30–120, with a large variation due to a combination of different telescopes, analysis techniques, and production routes; it is clear, however, that the column density derived from Source Model B is most consistent with previous determinations, whereas Source Model A represents a scenario not yet seen toward this source. Given, however, that we are not aware of any obvious reasons for such a significant deviation in chemical trends, we believe it is more likely than not that Source Model B is a better approximation to the chemical physics of cyanoacetyleneallene in TMC-1. This relatively consistent R-H/R-CN ratio has been discussed previously for the methyl-terminated carbon chains (Remijan et al. 2006). This analysis provides a strong motivation to further study the chemical relation between R-H and R-CN pairs, for which methyl-terminated carbon chains could provide an abundant family of molecules to study this relation in detail. Furthermore, since the radical addition of CN has been found to be efficient in interstellar conditions (Huang et al. 1999; Balucani et al. 1999, 2009, 2000; Kaiser & Balucani 2001; Lee et al. 2019; Cooke et al. 2020), this reaction could be crucial for understanding the relation between pure hydrocarbon rings and their recently detected cyano derivatives (McGuire et al. 2018, 2021; McCarthy et al. 2021; Lee et al. 2021c; Burkhardt et al. 2021).
Column density ratios of pure hydrocarbon and their CN derivatives detected toward TMC-1.
4. Astrochemical modeling
Astrochemical models were used to explore possible formation routes that could explain the observed abundance of cyanoacetyleneallene. For this, we employed the three-phase (gas, grain or ice mantle surface, and ice mantle bulk) NAUTILUS v1.1 code (Ruaud et al. 2016). The chemical network and physical conditions we used are based on those described in other recent GOTHAM project papers (Loomis et al. 2021; McGuire et al. 2020). Briefly, we ran 0D simulations using constant physical conditions relevant to TMC-1, including a gas and dust temperature of 10 K, a standard cosmic ray ionization rate of ζ = 1.3 × 10⁻¹⁷ s−1, and a standard chemical desorption efficiency of 1%. Initial elemental abundances were generally taken from Hincelin et al. (2011), with the exception of the initial C/O ratio; we assumed this ratio to be ∼1.1, which was found to yield the best agreement between our models and the abundances of the cyanopolyynes (Loomis et al. 2021).
We added a number of gas and grain reactions related to cyanoacetyleneallene to the GOTHAM network. As a preliminary test of whether the cyclic molecules detected in TMC-1 could have formed via grain-surface H-addition reactions to unsaturated carbon-chain species – and whether cyanoacetyleneallene might be an intermediate in this process – we included the following reaction pathway:
where the grain-surface H-addition reactions are assumed to proceed without barriers. There are a number of possible additional products that were not included. Since our goal in this work is to estimate the feasibility of such processes as a viable formation route to (ultimately) cyclic molecules, we simplified the chemistry to just the abovementioned reactions. Thus, abundances of H2CCCHC3N formed via (R1)–(R2) will likely be somewhat lower than what we predict in our simulations.
In addition to the grain-surface route given in (R1)–(R5), we also included three relevant gas-phase formation routes, given by (R6b), (R7e), and (R8). Two of the likely candidates (e.g., reactions between C3N and CH2CCH2 and CH3CCH) were studied by Fournier (2014), who measured the respective rate coefficients for temperatures in the range of 24 to 300 K. Fits of their experimental data to the Arrhenius-Kooij formula, given by
lead to the parameters shown in Table 2. From the values shown in Table 2, one can see that reactions (R6) and (R7) are very efficient even at the low temperatures of cold cores. Unfortunately, Fournier (2014) were not able to establish the nature of the products and their branching ratios based on data from the Cinétique de Réaction en Ecoulement Supersonique Uniforme (CRESU) experiments, but they suggested (R6a)–(R6b) and (R7a)–(R7d) as channels, as given below:

Arrhenius-Kooij parameters for the reaction between C3N and hydrocarbons from Fournier (2014).
Though Fournier and coworkers did not include H2CCCHC3N as a possible product of (R7), by analogy to similar reactions involving CN we have assumed that the formation of cyanoacetyleneallene (R7e) is in fact also a possible product channel. Here we have assumed equal branching fractions among all product channels based on analogous reactions and previous crossed beam studies by Huang et al. (1999).
Finally, given the recent detection of acetylene allene by Cernicharo et al. (2021b), we included the following third gas-phase formation route to cyanoacetyleneallene:

Here we have assumed a rate coefficient of kR8 = (1/3)×kR6 since (R8) and (R6) involve the same number of atoms and share a similar reaction mechanism, which implies that (R8) likewise has no entrance barrier and has long range interactions very similar to those of (R6). The 1/3 factor accounts for two other possible competing product channels. We note that we disregarded the reaction of the propargyl radical (C3H3) with cyanoacetylene based on results by da Silva (2017), who found evidence of an entrance barrier in the reaction C3H3+C2H2.
In addition to the previously noted formation routes, we also included destruction reactions with the ions  , He+, HCO+, and H3O+, where the Langevin formula was used to estimate rate coefficients (Woon & Herbst 2009). Gas-phase cyanoacetyleneallene is also depleted via accretion onto grains.
The results of our simulations are shown in Fig. 2. There we present results from two models. In the first, represented by blue lines, H2CCCHC3N was formed via both the grain-surface and gas-phase reactions. In the second, represented by red lines, H2CCCHC3N was made solely via the grain-surface route.
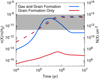 |
Fig. 2. Abundance of H2CCCHC3N both in the gas (solid lines) and in the mantle (dashed lines). Blue lines correspond to the model in which H2CCCHC3N was formed both in the gas and on grains, while red lines show results from the model in which cyanoacetyleneallene was produced only on grains. The range of column densities derived from Source Models A and B are represented by the horizontal gray bar. |
A comparison between the calculated abundances of cyanoacetyleneallene from the two models shows that inclusion of the gas-phase formation routes substantially increases its abundance over the predictions from the grain-surface-only routes by up to seven orders of magnitude at model times of about 2 × 10⁵ yr. It should be noted that in the gas and grain formation model, reaction (R6b) dominates at all relevant simulation times.
Given the range of derived column densities from the MCMC fits, comparison with astrochemical modeling results is not entirely straightforward. Nevertheless, with the gas-phase production routes included, the model is able to reproduce the more reasonable columns predicted by Source Model B, assuming N(H2) = 1022 cm−2 (Ohishi & Kaifu 1998), and even achieves a peak abundance within a factor of a few from the larger columns inferred from Source Model A. Taken together, our modeling data suggest that the gas-phase reactions are important formation routes for cyanoacetyleneallene.
Returning to Fig. 2, we note that in both models the abundance of H2CCCHC3N trapped in dust-grain ice mantles (dashed lines) is significant. A comparison between the two shows that while the effect of gas-phase accretion of cyanoacetyleneallene does enhance the solid-phase abundance somewhat, most of the H2CCCHC3N on grains is formed via the H-addition reactions given by (R1)–(R5). Thus, while the gas-phase formation routes, and in particular (R6b), seem to be the most important in explaining the observed gas-phase abundance of cyanoacetyleneallene in TMC-1, the grain-surface routes do seem to be efficient and might yield precursors to cyclic molecules upon further surface reactions with atomic hydrogen. This provides a strong motivation to further develop a robust chemical network of grain-surface saturation of carbon chains into cyclic molecules, which are currently underproduced in existing dark cloud chemical models (Burkhardt et al. 2021; McCarthy et al. 2021; McGuire et al. 2021).
5. Conclusions
In this work we have reported the velocity-stacked detection of cyanoacetyleneallene (H2CCCHC3N) in the cold core TMC-1. Our MCMC modeling with priors from two representative species, HC9N and c-C6H5CN, yielded substantially different derived column densities, 9 × 1013 cm−2 and 2 × 1011 cm−2, respectively. The disparate results are due to the strong covariance between column density and excitation temperature. In models using HC9N as a prior, predicted excitation temperatures were found to be close to the CMB temperature. Our MCMC model that uses c-C6H5CN as a prior both represents a more physically reasonable case of small column densities and yielded an excitation temperature more typical of molecules in TMC-1. Moreover, the minimum matched filter response obtained was 7σ based on a fiducial model – a significant and robust detection. Going forward, more informative priors placed on the sampling will significantly help constrain the model space.
In an attempt to investigate whether linear carbon-chain species such as C6N and HC6N could serve as precursors to cyclic molecules like cyanocyclopentadiene (c-C5H5CN) – and by extension whether H2CCCHC3N might represent an intermediate in this process – we included a number of grain-surface H-addition reactions that lead to cyanoacetyleneallene. Results from our astrochemical models indicate that while this grain-surface route does lead to large amounts of H2CCCHC3N on grain surfaces, the gas-phase reaction between C3N and both propyne (CH3CCH) and, in particular, allene (CH2CCH2) are likely the dominant formation routes for the gas-phase cyanoacetyleneallene detected in TMC-1.
Nevertheless, H2CCCHC3N on grain surfaces could still react with H atoms and therefore might yet represent an intermediate in a bottom-up formation route for the kinds of cyclic species now identified in TMC-1 (McGuire et al. 2018, 2021; McCarthy et al. 2021). Therefore, the preliminary grain-surface reactions presented here that connect the abundant carbon-chain species with cyclic molecules represent attractive targets for detailed study, either experimentally or via quantum-chemical calculations.
Thus, our finding that c-C6H5CN, rather than HC9N, is a more physically realistic prior for our H2CCCHC3N source models meshes nicely with our astrochemical modeling results since, taken together, they both seem to suggest that (a) long carbon-chain species, such as HC9N, are not direct precursors to the gas-phase cyanoacetyleneallene that was observed, but that (b) the grain-surface hydrogenation of cyanoacetyleneallene is efficient and might still be a promising bottom-up pathway to cyclic species such as benzonitrile under cold-core conditions.
Acknowledgments
C.N.S. thanks V. Wakelam for use of the Nautilus v1.1 code. M.C.M and K.L.K.L. acknowledge financial support from NSF grants AST-1908576, AST-1615847, and NASA grant 80NSSC18K0396. A.M.B. acknowledges support from the Smithsonian Institution as a Submillimeter Array (SMA) Fellow. S.B.C. was supported by the NASA Astrobiology Institute through the Goddard Center for Astrobiology. The National Radio Astronomy Observatory is a facility of the National Science Foundation operated under cooperative agreement by Associated Universities, Inc. The Green Bank Observatory is a facility of the National Science Foundation operated under cooperative agreement by Associated Universities, Inc. This research has made use of NASA’s Astrophysics Data System. Data Access and code. Data used for the MCMC analysis can be found in the DataVerse entry (https://doi.org/10.7910/DVN/K9HRCK). The code used to perform the analysis is part of the molsim open-source package; an archival version of the code can be accessed at Lee et al. (2021a).
References
- Agundez, M., Cabezas, C., Tercero, B., et al. 2021, A&A, 647, L10 [Google Scholar]
- Avery, L. W., Broten, N. W., MacLeod, J. M., Oka, T., & Kroto, H. W. 1976, ApJ, 205, L173 [Google Scholar]
- Balucani, N., Asvany, O., Chang, A. H. H., et al. 1999, J. Chem. Phys., 111, 7457 [Google Scholar]
- Balucani, N., Asvany, O., Osamura, Y., et al. 2000, Planet. Space Sci., 48, 447 [Google Scholar]
- Balucani, N., Bergeat, A., Cartechini, L., et al. 2009, J. Phys. Chem. A, 113, 11138 [Google Scholar]
- Broten, N. W., MacLeod, J. M., Oka, T., et al. 1976, ApJ, 209, L143 [Google Scholar]
- Broten, N. W., Oka, T., Avery, L. W., MacLeod, J. M., & Kroto, H. W. 1978, ApJ, 223, L105 [Google Scholar]
- Burkhardt, A. M., Loomis, R. A., Shingledecker, C. N., et al. 2021, Nat. Astron., 5, 181 [Google Scholar]
- Cabezas, C., Endo, Y., Roueff, E., et al. 2021, A&A, 646, L1 [Google Scholar]
- Cernicharo, J., Cabezas, C., Agundez, M., et al. 2021a, A&A, 647, L2 [Google Scholar]
- Cernicharo, J., Agundez, M., Cabezas, C., et al. 2021b, A&A, 647, L3 [Google Scholar]
- Cernicharo, J., Cabezas, C., Bailleux, S., et al. 2021c, A&A, 646, L7 [Google Scholar]
- Cooke, I. R., Gupta, D., Messinger, J. P., & Sims, I. R. 2020, ApJ, 891, L41 [Google Scholar]
- da Silva, G. 2017, J. Phys. Chem. A, 121, 2086 [Google Scholar]
- Dobashi, K., Shimoikura, T., Nakamura, F., et al. 2018, ApJ, 864, 82 [Google Scholar]
- Dobashi, K., Shimoikura, T., Ochiai, T., et al. 2019, ApJ, 879, 88 [Google Scholar]
- Fixsen, D. J. 2009, ApJ, 707, 916 [Google Scholar]
- Foreman-Mackey, D., Hogg, D. W., Lang, D., & Goodman, J. 2013, PASP, 125, 306 [Google Scholar]
- Fournier, M. 2014, These de doctorat, Rennes 1, France [Google Scholar]
- Hincelin, U., Wakelam, V., Hersant, F., et al. 2011, A&A, 530, A61 [Google Scholar]
- Huang, L. C. L., Balucani, N., Lee, Y. T., Kaiser, R. I., & Osamura, Y. 1999, J. Chem. Phys., 111, 2857 [Google Scholar]
- Kaiser, R. I., & Balucani, N. 2001, Acc. Chem. Res., 34, 699 [CrossRef] [Google Scholar]
- Kroto, H. W., Kirby, C., Walton, D. R. M., et al. 1978, ApJ, 219, L133 [Google Scholar]
- Kumar, R., Carroll, C., Hartikainen, A., & Martin, O. 2019, J. Open Source Softw., 4, 1143 [Google Scholar]
- Lee, K. L. K., McGuire, B. A., & McCarthy, M. C. 2019, Phys. Chem. Chem. Phys., 21, 2946 [Google Scholar]
- Lee, K. L. K., Loomis, R. A., & McGuire, B. 2021a, https://doi.org/10.5281/zenodo.4560750 [Google Scholar]
- Lee, K. L. K., Loomis, R. A., Burkhardt, A. M., et al. 2021b, ApJ, 908, L11 [Google Scholar]
- Lee, K. L. K., Changala, P. B., Loomis, R. A., et al. 2021c, ApJ, 910, L2 [Google Scholar]
- Little, L. T., MacDonald, G. H., Riley, P. W., & Matheson, D. N. 1978, MNRAS, 183, 45P [Google Scholar]
- Loomis, R. A., Shingledecker, C. N., Langston, G., et al. 2016, MNRAS, 463, 4175 [Google Scholar]
- Loomis, R. A., Burkhardt, A. M., Shingledecker, C. N., et al. 2021, Nat. Astron., 5, 188 [Google Scholar]
- Marcelino, N., Tercero, B., Agúndez, M., & Cernicharo, J. 2021, A&A, 646, L9 [Google Scholar]
- McCarthy, M. C., Lee, K. L. K., Carroll, P. B., et al. 2020, J. Phys. Chem. A, 124, 5170 [Google Scholar]
- McCarthy, M. C., Lee, K. L. K., Loomis, R. A., et al. 2021, Nat. Astron., 5, 176 [Google Scholar]
- McGuire, B. A., Burkhardt, A. M., Kalenskii, S., et al. 2018, Science, 359, 202 [Google Scholar]
- McGuire, B. A., Burkhardt, A. M., Loomis, R. A., et al. 2020, ApJ, 900, L10 [Google Scholar]
- McGuire, B. A., Loomis, R. A., Burkhardt, A. M., et al. 2021, Science, 371, 1265 [Google Scholar]
- Ohishi, M., & Kaifu, N. 1998, Faraday Discuss., 109, 205 [NASA ADS] [CrossRef] [Google Scholar]
- Remijan, A. J., Hollis, J. M., Snyder, L. E., Jewell, P. R., & Lovas, F. J. 2006, ApJ, 643, L37 [Google Scholar]
- Ruaud, M., Wakelam, V., & Hersant, F. 2016, MNRAS, 459, 3756 [NASA ADS] [CrossRef] [Google Scholar]
- Snyder, L. E., Hollis, J. M., Jewell, P. R., Lovas, F. J., & Remijan, A. 2006, ApJ, 647, 412 [Google Scholar]
- Turner, B. E. 1971, ApJ, 163, L35 [Google Scholar]
- Winnewisser, G., & Walmsley, C. M. 1978, A&A, 70, L37 [NASA ADS] [Google Scholar]
- Woon, D. E., & Herbst, E. 2009, ApJS, 185, 273 [NASA ADS] [CrossRef] [Google Scholar]
Appendix A: MCMC posterior analysis
Figures A.1 and A.2 show corner plots of the posterior distributions for cyanoacetyleneallene when using HC9N (Source Model A) or benzonitrile (Source Model B) as informative priors. The diagonal traces correspond to empirical cumulative distribution function (ECDF) plots, which show the range of values considered in the MCMC sampling, while the off-diagonal contours reveal covariances between parameters. The source sizes are not shown in either plot as they are fixed to their respective values and unchanged throughout the MCMC sampling.
An important aspect in Fig. A.1 is the extremely large covariance between excitation temperature (Tex) and column density (Ncol) for all four sources: Higher excitation temperatures correspond to smaller column densities and likely represent insufficient data coverage, which would help constrain the range of temperatures that would be consistent with the data. Table A.1 summarizes the MCMC results and, ultimately, the parameters used for the spectral simulation and matched filtering.
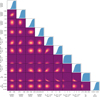 |
Fig. A.1. Corner plot for cyanoacetyleneallene using HC9N as a prior, referred to as Source Model A in the text. Traces on the diagonal correspond to cumulative density plots, which represent the integral over parameter space for the marginal likelihood of each parameter. |
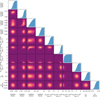 |
Fig. A.2. Corner plot for cyanoacetyleneallene using c-C6H5CN as a prior, referred to as Source Model B in the text. Traces on the diagonal correspond to cumulative density plots, which represent the integral over parameter space for the marginal likelihood of each parameter. |
Summary statistics of posterior values obtained from the MCMC sampling as well as for the fiducial spectral simulation. Uncertainties correspond to the 2nd and 97th percentile posterior likelihood (i.e., the 95% highest posterior densities); values without uncertainties are fixed to their prior values. Excitation temperatures and line widths are shared amongst the four velocity components.
All Tables
Column density ratios of pure hydrocarbon and their CN derivatives detected toward TMC-1.
Arrhenius-Kooij parameters for the reaction between C3N and hydrocarbons from Fournier (2014).
Summary statistics of posterior values obtained from the MCMC sampling as well as for the fiducial spectral simulation. Uncertainties correspond to the 2nd and 97th percentile posterior likelihood (i.e., the 95% highest posterior densities); values without uncertainties are fixed to their prior values. Excitation temperatures and line widths are shared amongst the four velocity components.
All Figures
|
Fig. 1. Evidence for the detection of allenyl acetylene. Left: velocity stack of the observations (blue) and the two MCMC models. Right: matched filter responses of the three models considered; see text for details. |
| In the text | |
|
Fig. 2. Abundance of H2CCCHC3N both in the gas (solid lines) and in the mantle (dashed lines). Blue lines correspond to the model in which H2CCCHC3N was formed both in the gas and on grains, while red lines show results from the model in which cyanoacetyleneallene was produced only on grains. The range of column densities derived from Source Models A and B are represented by the horizontal gray bar. |
| In the text | |
|
Fig. A.1. Corner plot for cyanoacetyleneallene using HC9N as a prior, referred to as Source Model A in the text. Traces on the diagonal correspond to cumulative density plots, which represent the integral over parameter space for the marginal likelihood of each parameter. |
| In the text | |
|
Fig. A.2. Corner plot for cyanoacetyleneallene using c-C6H5CN as a prior, referred to as Source Model B in the text. Traces on the diagonal correspond to cumulative density plots, which represent the integral over parameter space for the marginal likelihood of each parameter. |
| In the text | |
Current usage metrics show cumulative count of Article Views (full-text article views including HTML views, PDF and ePub downloads, according to the available data) and Abstracts Views on Vision4Press platform.
Data correspond to usage on the plateform after 2015. The current usage metrics is available 48-96 hours after online publication and is updated daily on week days.
Initial download of the metrics may take a while.