Fig. 9.
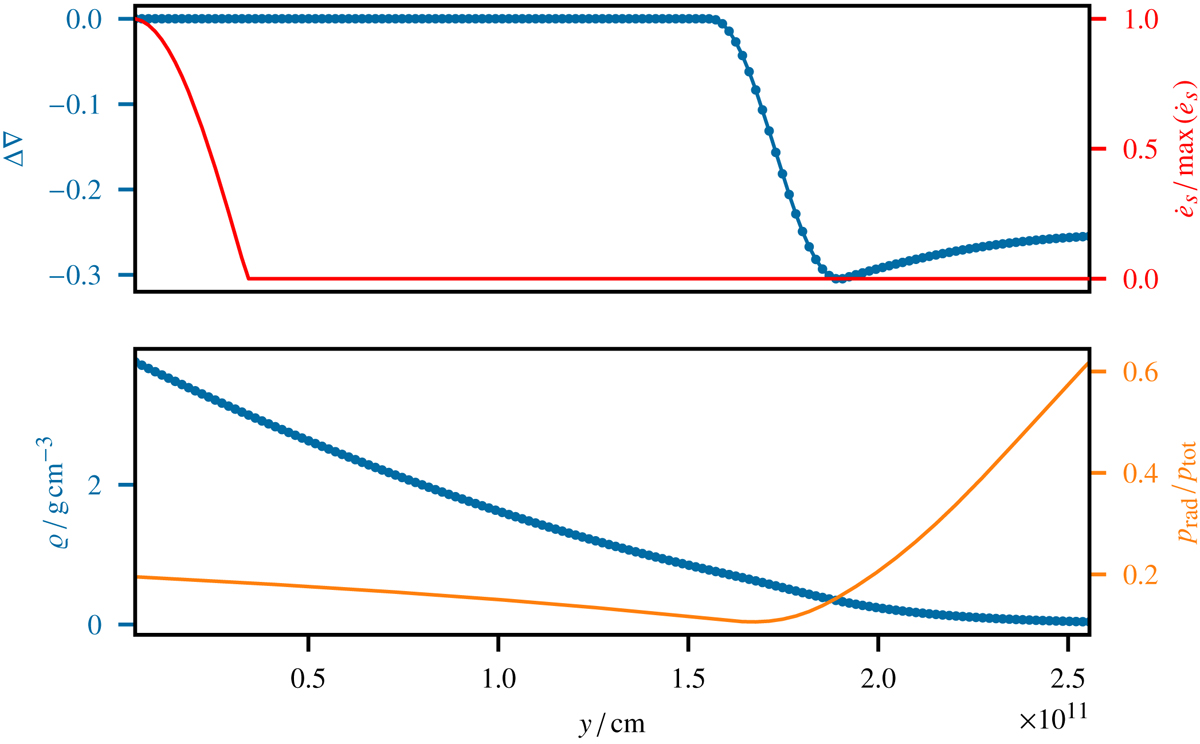
Initial stratification of the convection setup. The red curve illustrates the position and shape of the energy injection which has nonzero values only at the bottom of the convection zone. Its actual amplitude is set for the different simulations individually. Dots denote the positions of cell centers on a grid with 144 vertical cells, the lowest resolution used in the SLH simulations presented in this section.
Current usage metrics show cumulative count of Article Views (full-text article views including HTML views, PDF and ePub downloads, according to the available data) and Abstracts Views on Vision4Press platform.
Data correspond to usage on the plateform after 2015. The current usage metrics is available 48-96 hours after online publication and is updated daily on week days.
Initial download of the metrics may take a while.