Fig. 6.
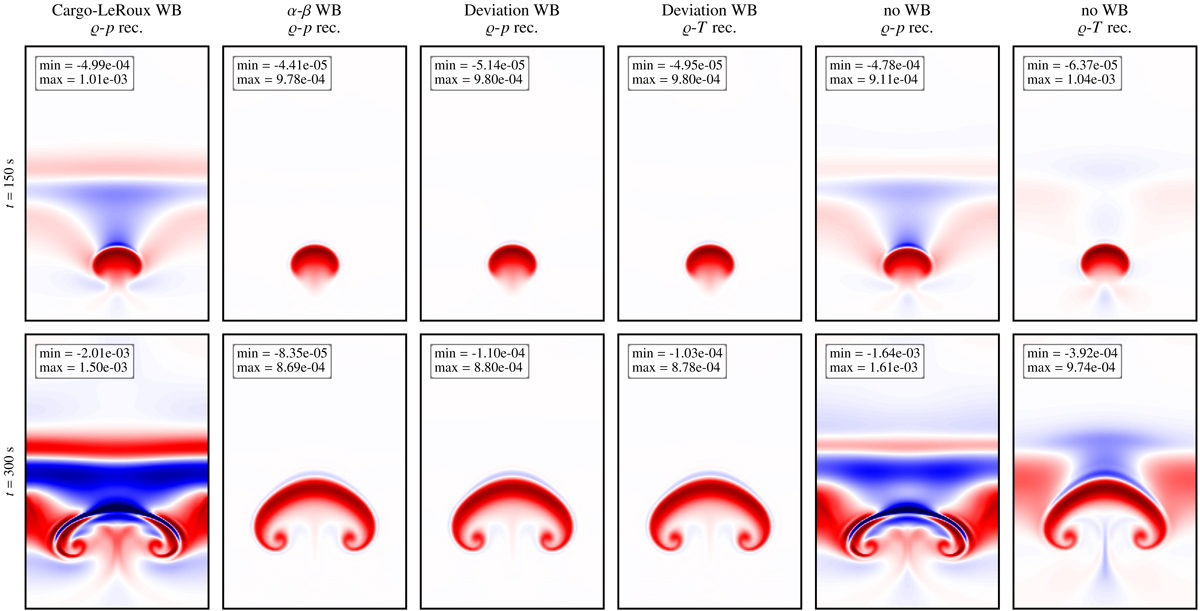
Time evolution (top to bottom) of the hot-bubble problem when solved using different well-balancing and reconstruction schemes (left to right) on a 128 × 192 grid. In all of the cases, entropy fluctuations ΔA/A are shown on the same color scale ranging from −10−3 (dark blue) through 0 (white) to 10−3 (dark red). The minimum and maximum values of ΔA/A in the whole simulation box are given in each panel’s inset. The amplitude of the initial entropy perturbation is (ΔA/A)t = 0 = 10−3.
Current usage metrics show cumulative count of Article Views (full-text article views including HTML views, PDF and ePub downloads, according to the available data) and Abstracts Views on Vision4Press platform.
Data correspond to usage on the plateform after 2015. The current usage metrics is available 48-96 hours after online publication and is updated daily on week days.
Initial download of the metrics may take a while.