Fig. C.1.
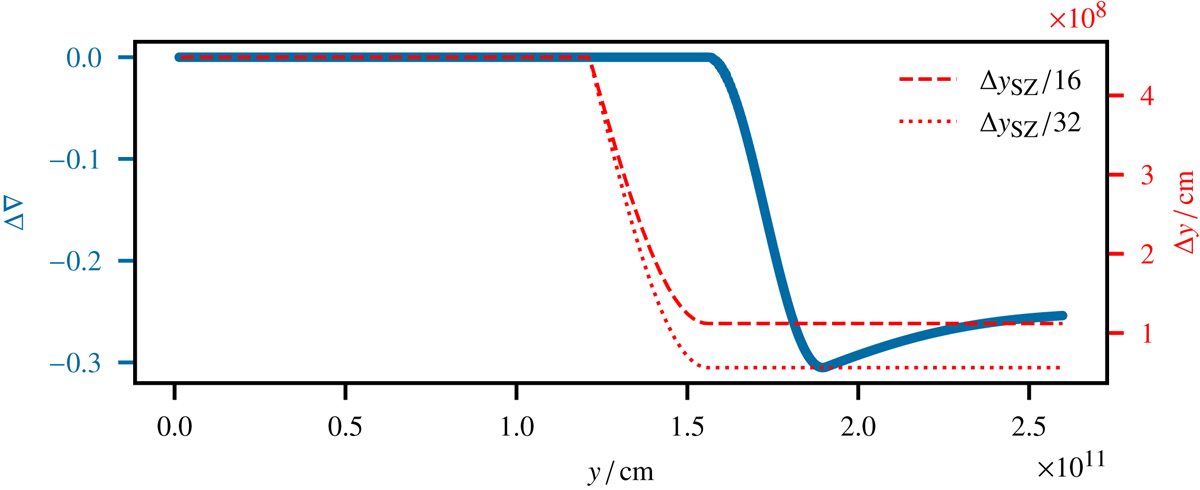
Varying vertical grid spacing as a function of the vertical coordinate y for the simulations shown in the center and right panels of the lower row in Fig. 13. The superadiabaticity is shown as a blue line, a negative value indicates a convectively stable stratification. The spacing changes smoothly to a finer resolution slightly before the transition to the stable zone starts.
Current usage metrics show cumulative count of Article Views (full-text article views including HTML views, PDF and ePub downloads, according to the available data) and Abstracts Views on Vision4Press platform.
Data correspond to usage on the plateform after 2015. The current usage metrics is available 48-96 hours after online publication and is updated daily on week days.
Initial download of the metrics may take a while.