Fig. 13.
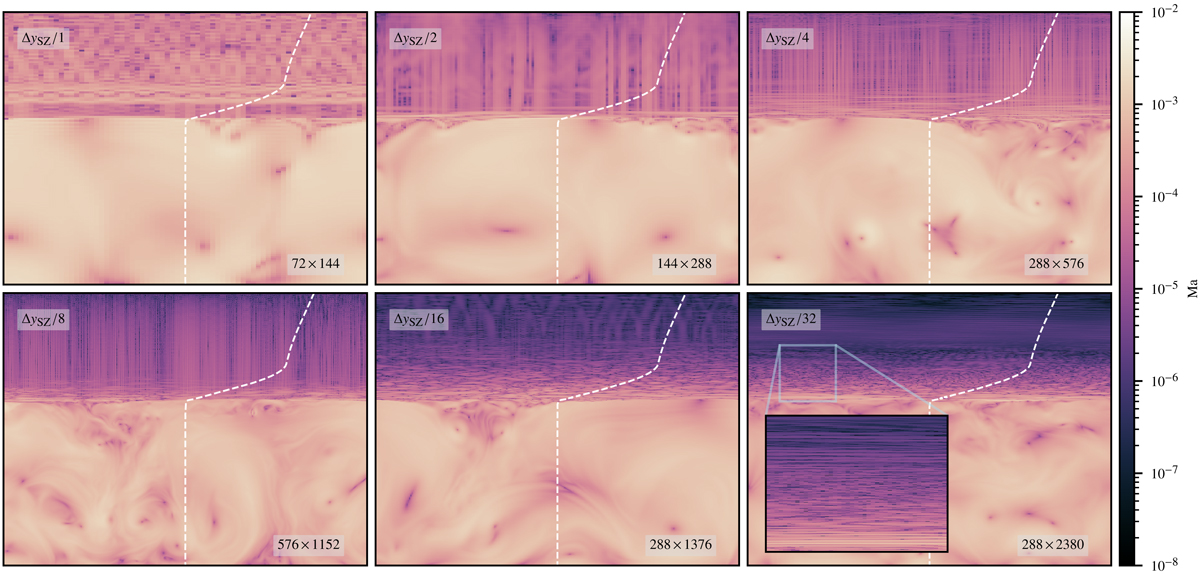
Mach number for a heating rate of ė0 = 104 and deviation well-balancing at different resolutions. The upper left box in each panel indicates the change in the vertical resolution relative to the resolution used for the Mach number scaling. The lower right box gives the total number of cells of the particular simulation. All snapshots are taken as soon as convection has fully developed. The dashed white line illustrates the profile of the Brunt–Väisälä frequency as a function of height with arbitrary units on the x-axis.
Current usage metrics show cumulative count of Article Views (full-text article views including HTML views, PDF and ePub downloads, according to the available data) and Abstracts Views on Vision4Press platform.
Data correspond to usage on the plateform after 2015. The current usage metrics is available 48-96 hours after online publication and is updated daily on week days.
Initial download of the metrics may take a while.