Fig. 1
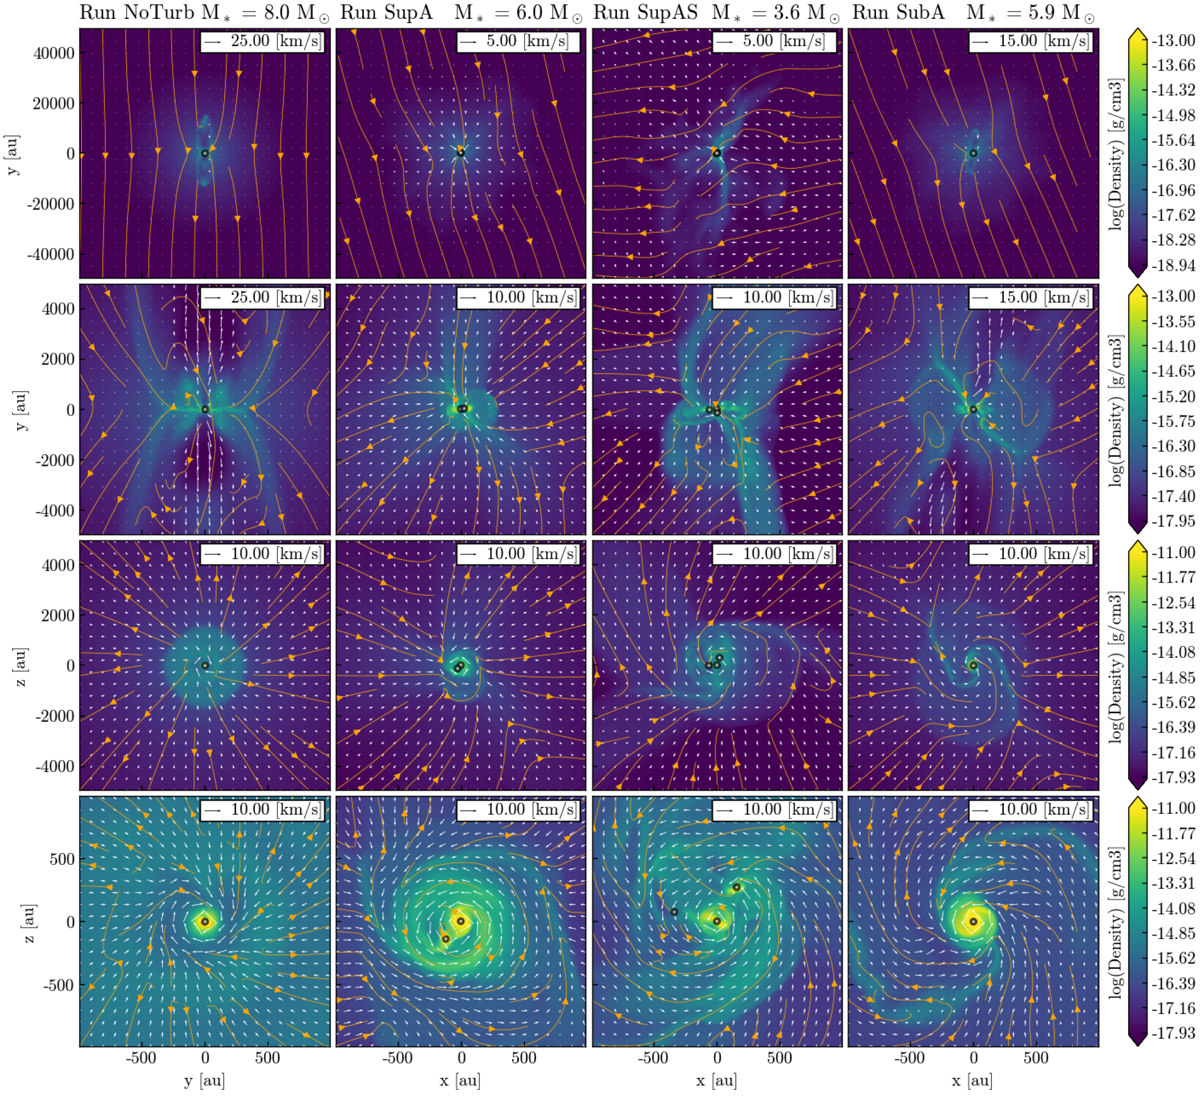
Density slices perpendicular (first and second row, zoomed by a factor of 10) and parallel (third and fourth row, zoomed by a factor of 5) to the disk plane, at t ≈ 50 kyr. Streamlines corresponding to magnetic field lines and arrows corresponding to the velocity field are overplotted. Columns from left to right: Runs NOTURB, SUPA, SUPAS, and SUBA. The mass density ρ = 10−19 g cm−3 corresponds to the particle density n = 2.6 × 104 cm−3 and ρ = 10−11 g cm−3 to n = 2.6 × 1012 cm−3. White dots represent sink particles.
Current usage metrics show cumulative count of Article Views (full-text article views including HTML views, PDF and ePub downloads, according to the available data) and Abstracts Views on Vision4Press platform.
Data correspond to usage on the plateform after 2015. The current usage metrics is available 48-96 hours after online publication and is updated daily on week days.
Initial download of the metrics may take a while.