Fig. 4
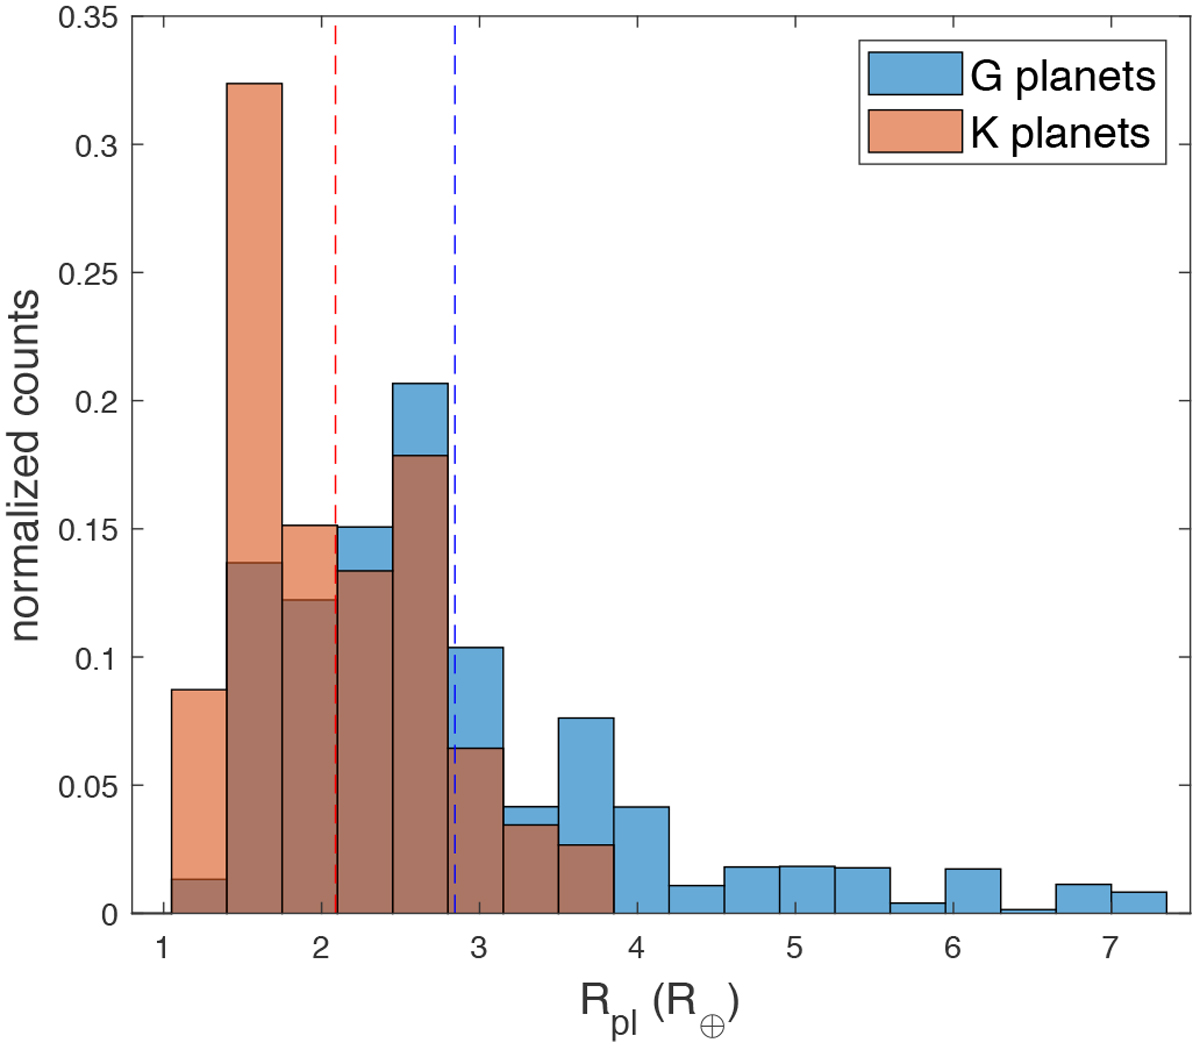
Simulated values of planetary radii accounting for the measurement uncertainties. For each planet in the sample, we simulated 10 000 radii and took the uncertainty into account. The mean values are presented as dashed lines. The histogram of the simulated populations shows the same tendency as the original histogram (see Fig. 3).
Current usage metrics show cumulative count of Article Views (full-text article views including HTML views, PDF and ePub downloads, according to the available data) and Abstracts Views on Vision4Press platform.
Data correspond to usage on the plateform after 2015. The current usage metrics is available 48-96 hours after online publication and is updated daily on week days.
Initial download of the metrics may take a while.