Fig. 2
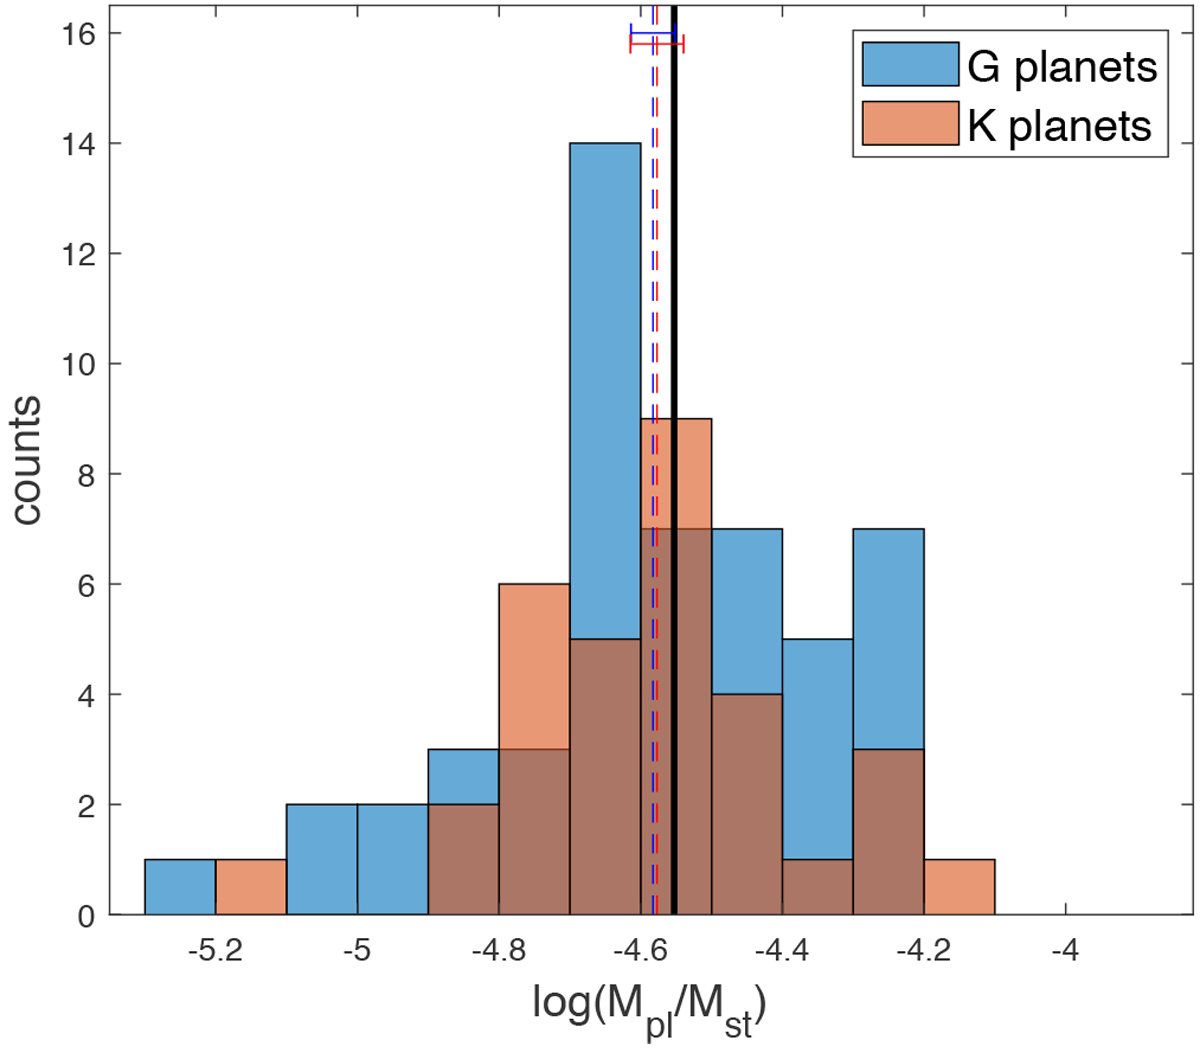
Histogram of the planet-to-star mass ratio for the two subsamples. It can be compared to Fig. 1 of Pascucci et al. (2018). The value of qbr of Pascucci et al. (2018) of log(Mpl∕M*) = −4.55 ± 0.03 is presented as a vertical black line and can be compared with mean values we calculated: − 4.59 ± 0.03 (G planets, red dashed line) and − 4.58 ± 0.04 (K planets, blue dashed line).
Current usage metrics show cumulative count of Article Views (full-text article views including HTML views, PDF and ePub downloads, according to the available data) and Abstracts Views on Vision4Press platform.
Data correspond to usage on the plateform after 2015. The current usage metrics is available 48-96 hours after online publication and is updated daily on week days.
Initial download of the metrics may take a while.