Fig. 1
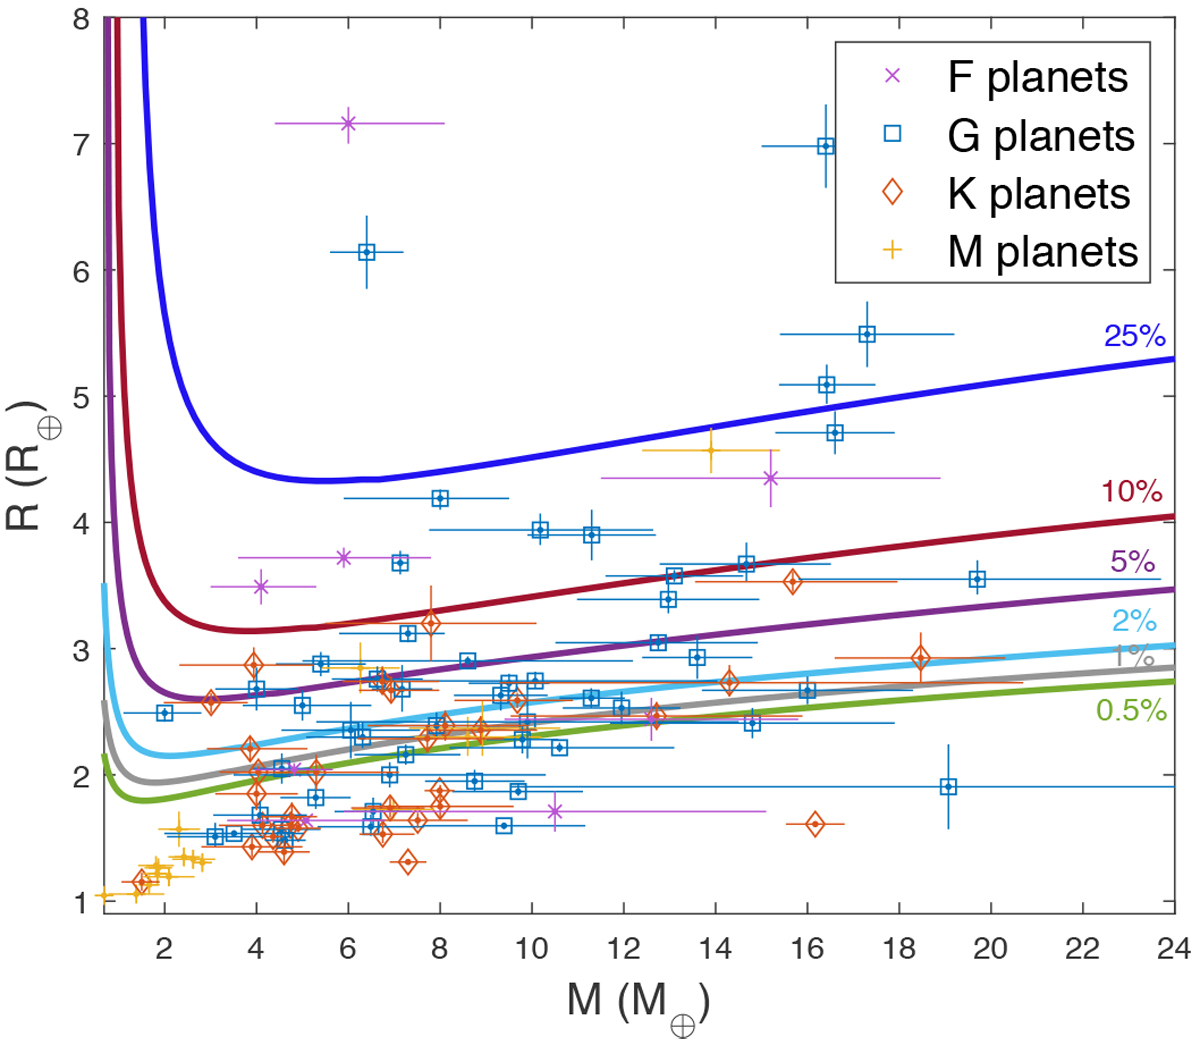
M-R diagram for the planetary sample. The dots with error bars correspond to F planets (purple crosses), G planets (blue squares), K planets (red diamonds), and M planets (yellow pluses). Only G and K planets are used in the analysis. The solid colored curves are M-R relations for various theoretical models with different mass fractions of H-He and constant H2 O mass fraction in the envelope (see Sect. 2.3 for details). The curves correspond to models with a Teq of 700 K (shown as examples).
Current usage metrics show cumulative count of Article Views (full-text article views including HTML views, PDF and ePub downloads, according to the available data) and Abstracts Views on Vision4Press platform.
Data correspond to usage on the plateform after 2015. The current usage metrics is available 48-96 hours after online publication and is updated daily on week days.
Initial download of the metrics may take a while.