Fig. 9.
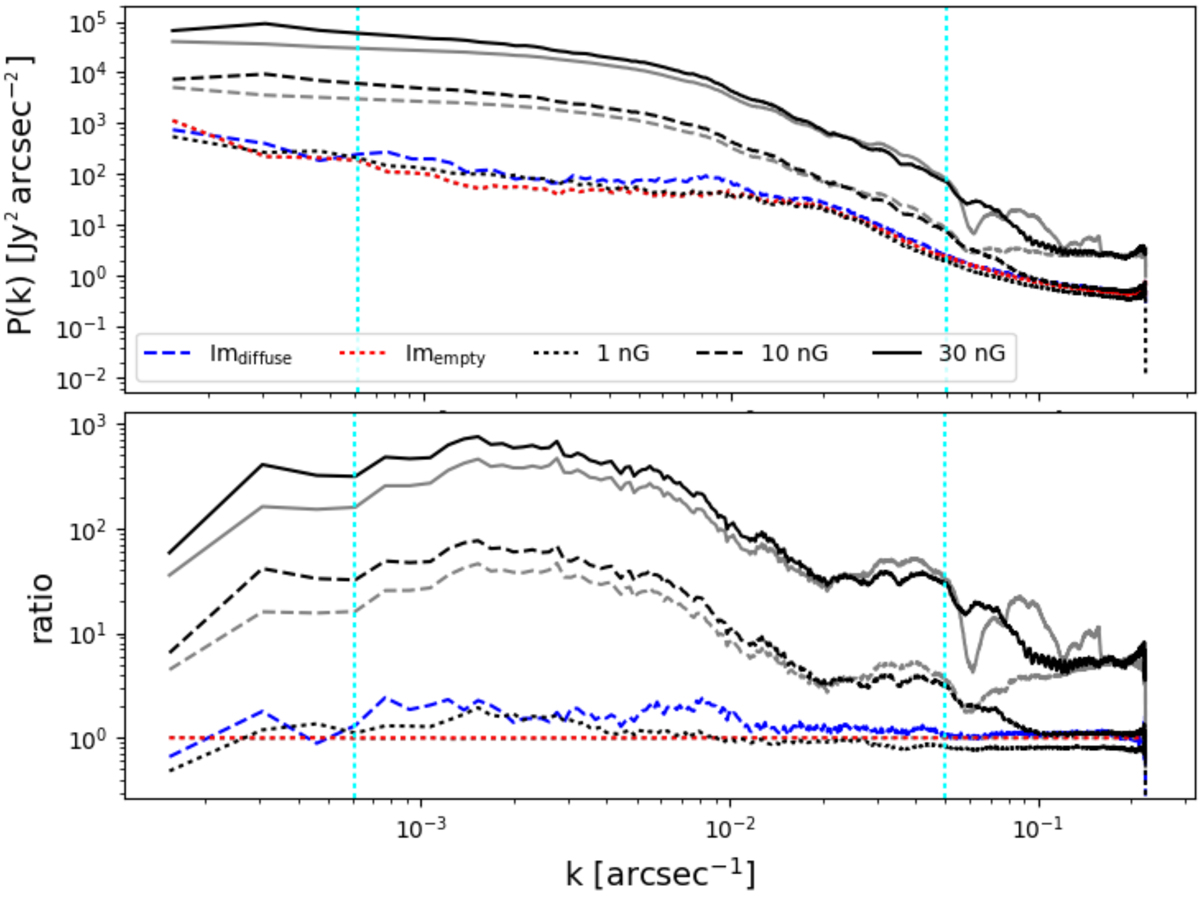
Power spectrum of the injected filament shown in Fig. 4 for different B0 models, as labelled. The vertical cyan dotted lines show the integration scale limits used to compute PS. They correspond respectively to about half the largest scale in the image k−1 = 2173″ ∼ 483 pixels and k−1 = 40″ (corresponding to twice the synthesised beam full width at half maximum scale). The black lines show P(k) resulting from the source injection into uvw visibilities, whereas the grey lines show the result from the image-plane addition of the simulated image onto Imempty. Lower panel: same power spectra as in the upper panel, divided by the Imempty line.
Current usage metrics show cumulative count of Article Views (full-text article views including HTML views, PDF and ePub downloads, according to the available data) and Abstracts Views on Vision4Press platform.
Data correspond to usage on the plateform after 2015. The current usage metrics is available 48-96 hours after online publication and is updated daily on week days.
Initial download of the metrics may take a while.