Fig. 7.
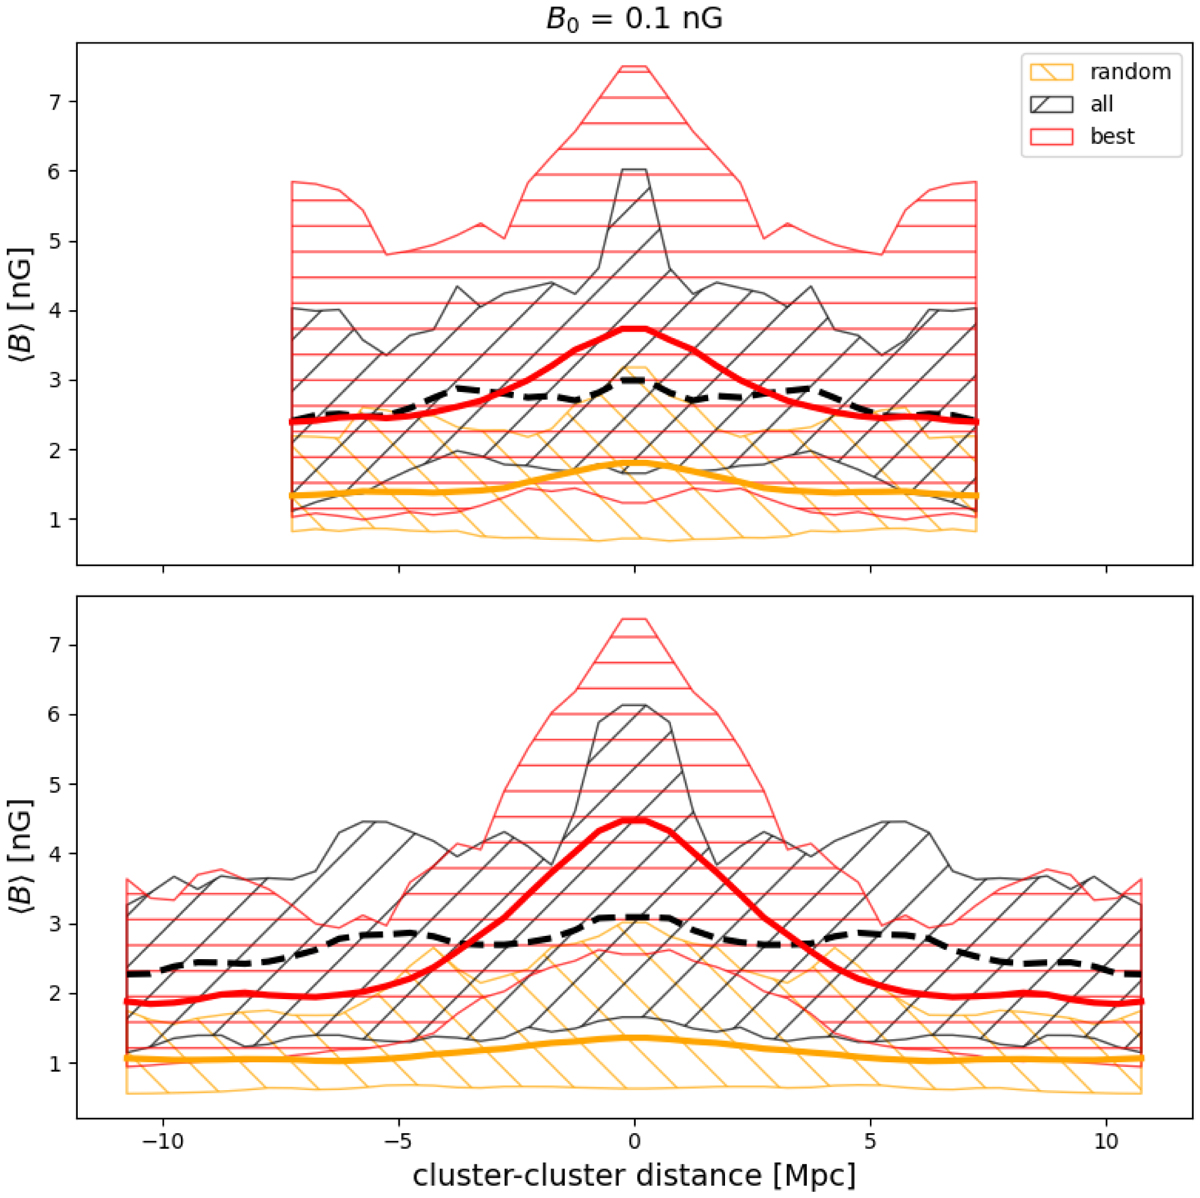
Magnetic field profile along the cluster-to-cluster distance. Upper panel: average profile of mass-weighted magnetic field strength resulting from the B0 = 0.1 nG model for all inter-cluster filaments (black), extracted to resemble the cluster pair RXC_J1155−J1156; for the best subsample (red); and for a sample of images sampling an equal linear size (15 Mpc) extracted at random locations in the simulation (orange). The solid lines give the median values of the samples, while the filled areas encompass the 10−90th percentiles of the distributions. Lower panel: same plot, but for the mock sample extracted for RXC_J1659−J1702.
Current usage metrics show cumulative count of Article Views (full-text article views including HTML views, PDF and ePub downloads, according to the available data) and Abstracts Views on Vision4Press platform.
Data correspond to usage on the plateform after 2015. The current usage metrics is available 48-96 hours after online publication and is updated daily on week days.
Initial download of the metrics may take a while.