Fig. 6.
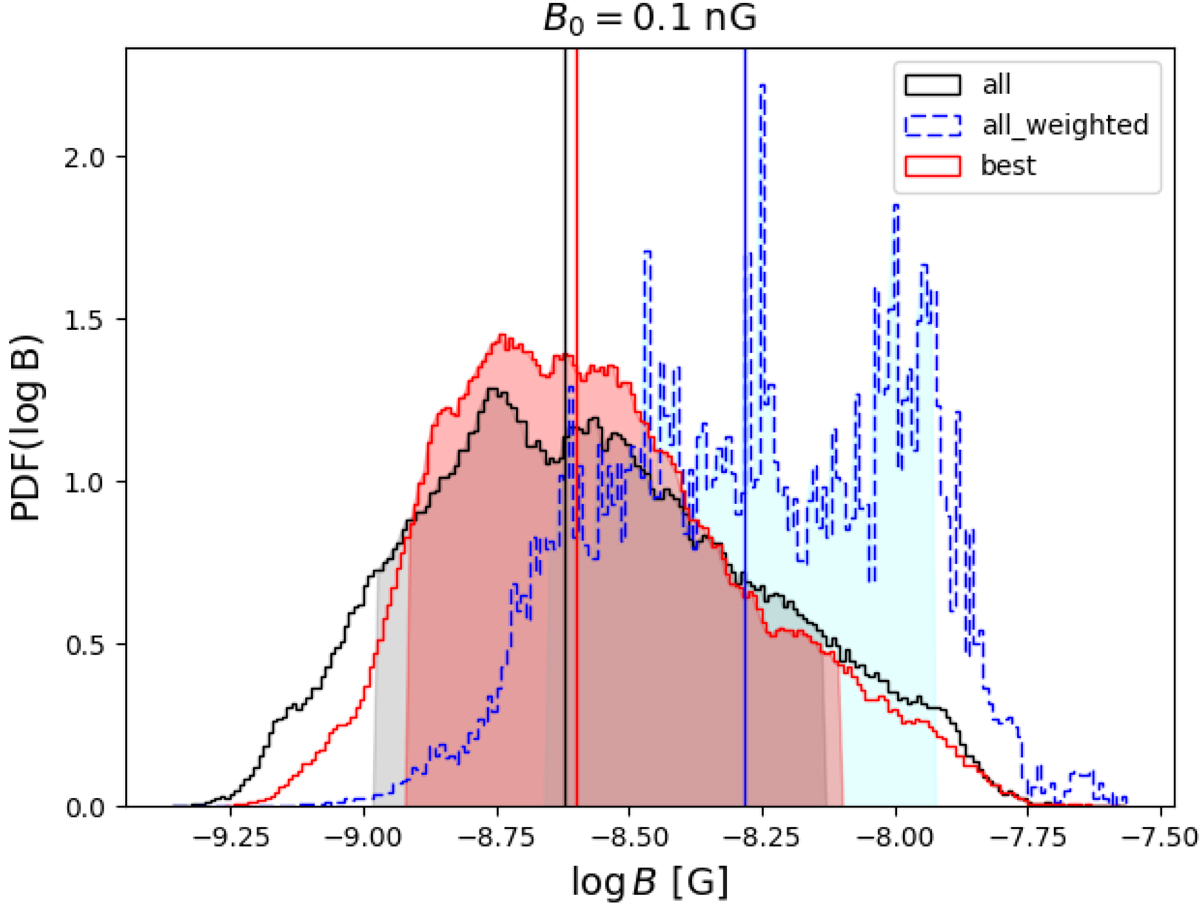
PDFs of the log B10 Mpc field across all the simulated filaments in the B0 = 0.1 nG model, for all the pairs in the mock sample (black line) and for the best subsample (red line). The dashed blue lines show the log B10 Mpc distribution from all pairs weighted over the pixel emissivity. The filled hatched areas encompass the 10−90 percentile ranges. The vertical solid lines show the median of the distributions.
Current usage metrics show cumulative count of Article Views (full-text article views including HTML views, PDF and ePub downloads, according to the available data) and Abstracts Views on Vision4Press platform.
Data correspond to usage on the plateform after 2015. The current usage metrics is available 48-96 hours after online publication and is updated daily on week days.
Initial download of the metrics may take a while.