Fig. 5.
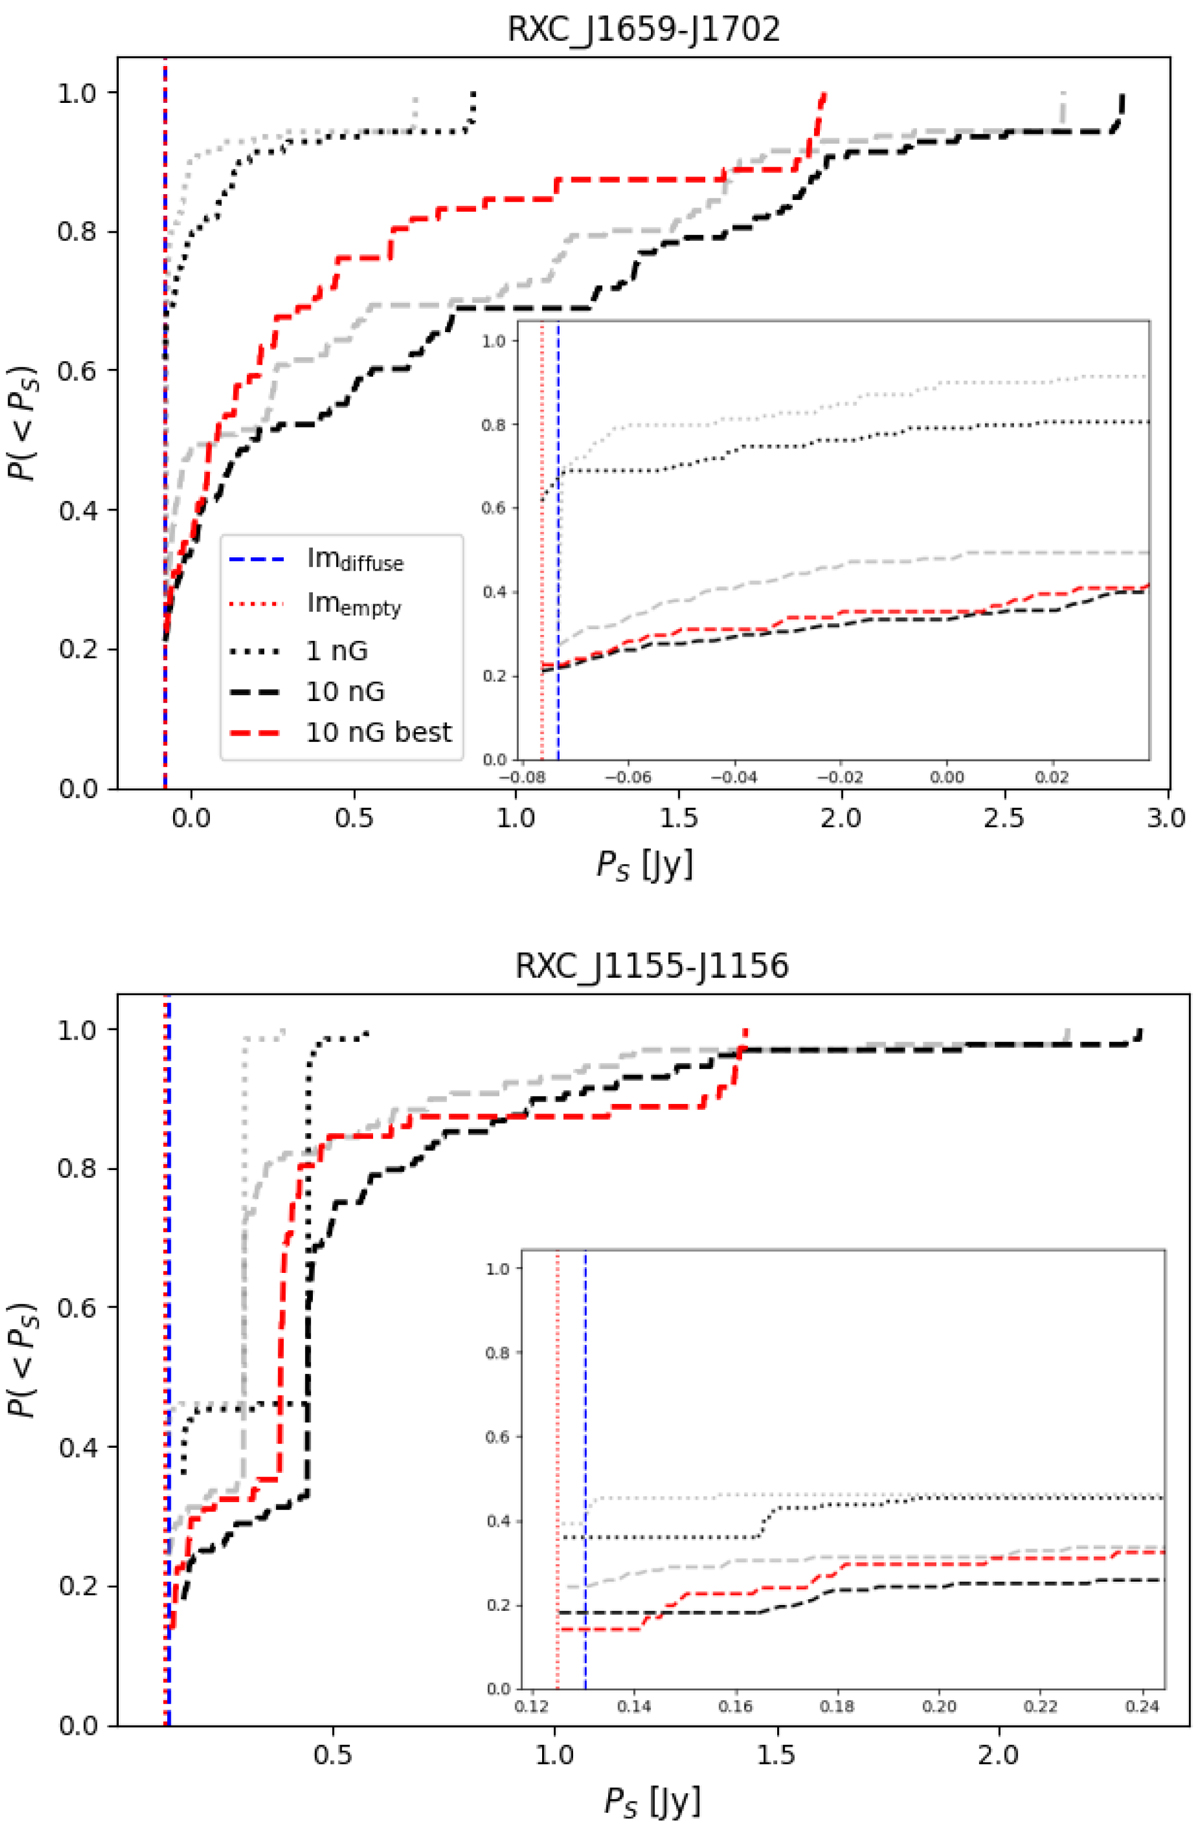
Probability distributions of finding statistics PS smaller than the values set by the cluster pair RXC_J1659−J1702 (upper panel) and RXC_J1155−J1156 (lower panel) for scenarios with B0 as labelled. The vertical lines show the PS values computed without any injection from Imempty (red dotted) or Imdiffuse (blue dashed). The black and grey lines show results for source injection performed respectively in the visibility and image domains. The insets show a zoom-in on the bins where ![]() .
.
Current usage metrics show cumulative count of Article Views (full-text article views including HTML views, PDF and ePub downloads, according to the available data) and Abstracts Views on Vision4Press platform.
Data correspond to usage on the plateform after 2015. The current usage metrics is available 48-96 hours after online publication and is updated daily on week days.
Initial download of the metrics may take a while.