Fig. 4.
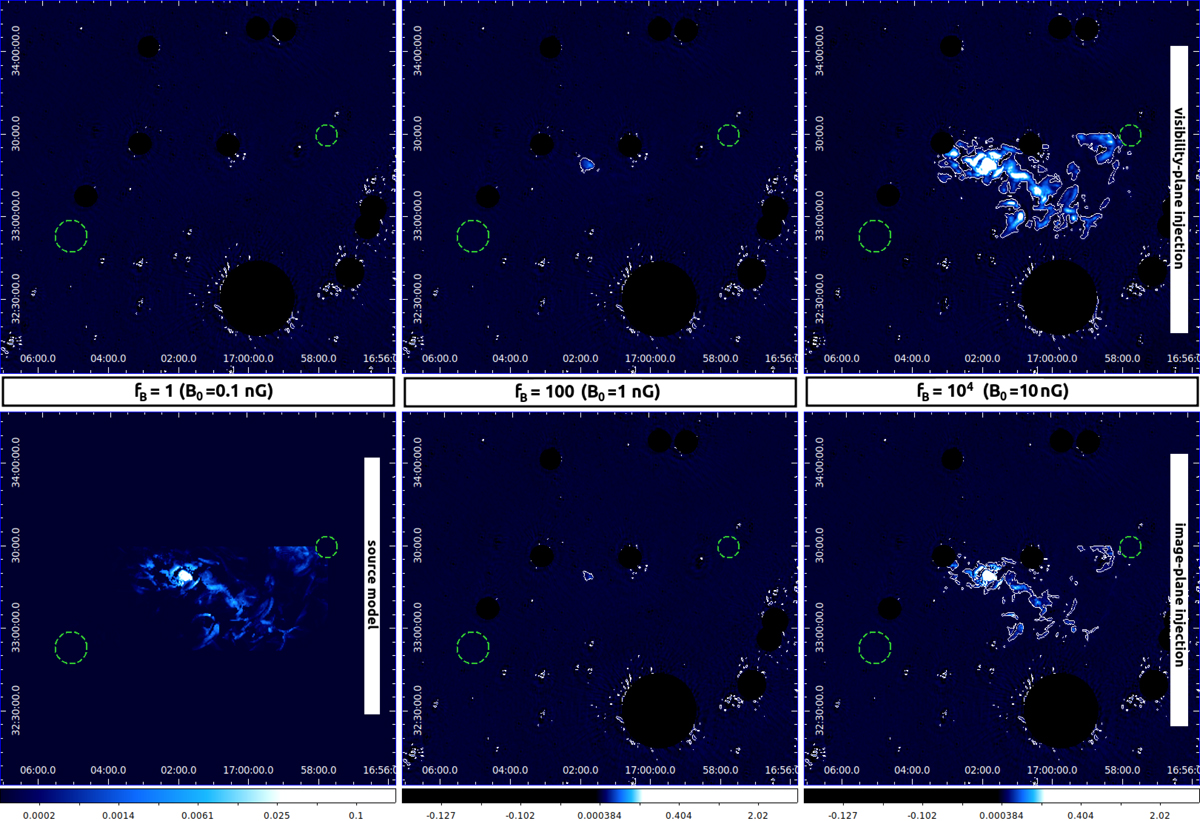
Example of source injection. The model of diffuse emission between a pair of simulated galaxy clusters (masked within their R200; green dashed circles) found in the simulation with B0 = 0.1 nG (lower left panel) is multiplied by a factor fB = 1, 102, 104 imaged and masked after being injected into the source-subtracted sky visibilities (upper left, upper central, and upper right panels, respectively), or it is injected through the image-plane (lower centre and lower right panels for fB = 102 and 104, respectively). The image with fB = 1 in the upper left panel, due to the very low brightness of the model with B0 = 0.1 nG, is equal to the source-subtracted sky image Imempty, where the only features are the residuals from the source subtraction process that fall outside the masks. The white contours are set to 5 times the rms value in Imempty.
Current usage metrics show cumulative count of Article Views (full-text article views including HTML views, PDF and ePub downloads, according to the available data) and Abstracts Views on Vision4Press platform.
Data correspond to usage on the plateform after 2015. The current usage metrics is available 48-96 hours after online publication and is updated daily on week days.
Initial download of the metrics may take a while.