Fig. 4.
Download original image
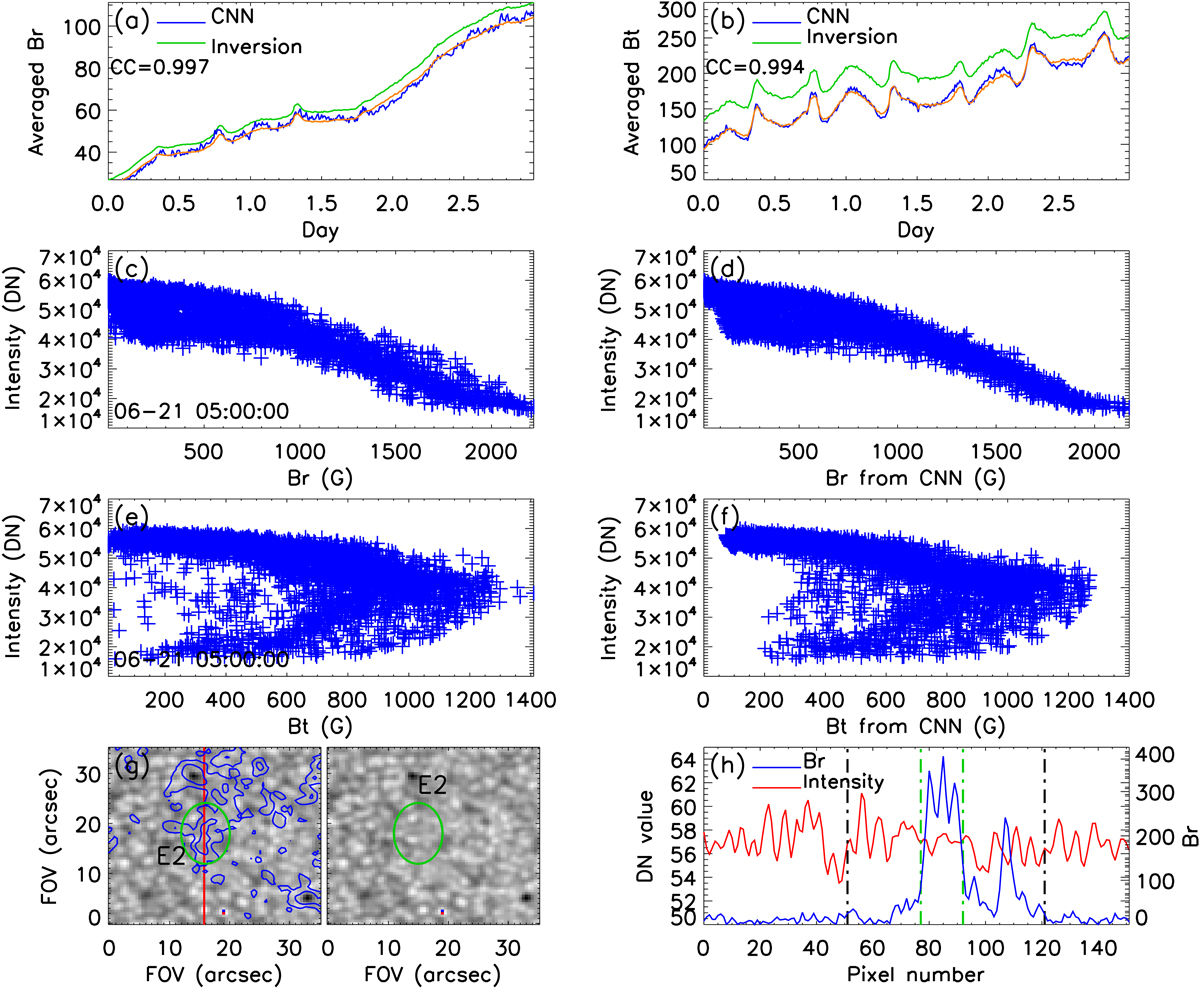
Evolution of the averaged |Br| (panel a) and Bt (panel b) for SHARP number 2875 within about three days. Panels c and d: scatter plots of the continuum brightness in Fig. 3h vs. the |Br| from Stokes inversion and CNN model methods, respectively. The one between the continuum brightness and Bt is shown in panels e and f. The left and right images in panel g being Region R2 in Fig. 2a are the same with the exception that the left part is overplotted with the contour of Br. The contour levels are 45 and 200 G. The green ellipse E2 denotes the strong network region. Panel h: value of the continuum image extracted from the red line L1 in Fig. 2a, while the blue line represents the corresponding Br value.
Current usage metrics show cumulative count of Article Views (full-text article views including HTML views, PDF and ePub downloads, according to the available data) and Abstracts Views on Vision4Press platform.
Data correspond to usage on the plateform after 2015. The current usage metrics is available 48-96 hours after online publication and is updated daily on week days.
Initial download of the metrics may take a while.