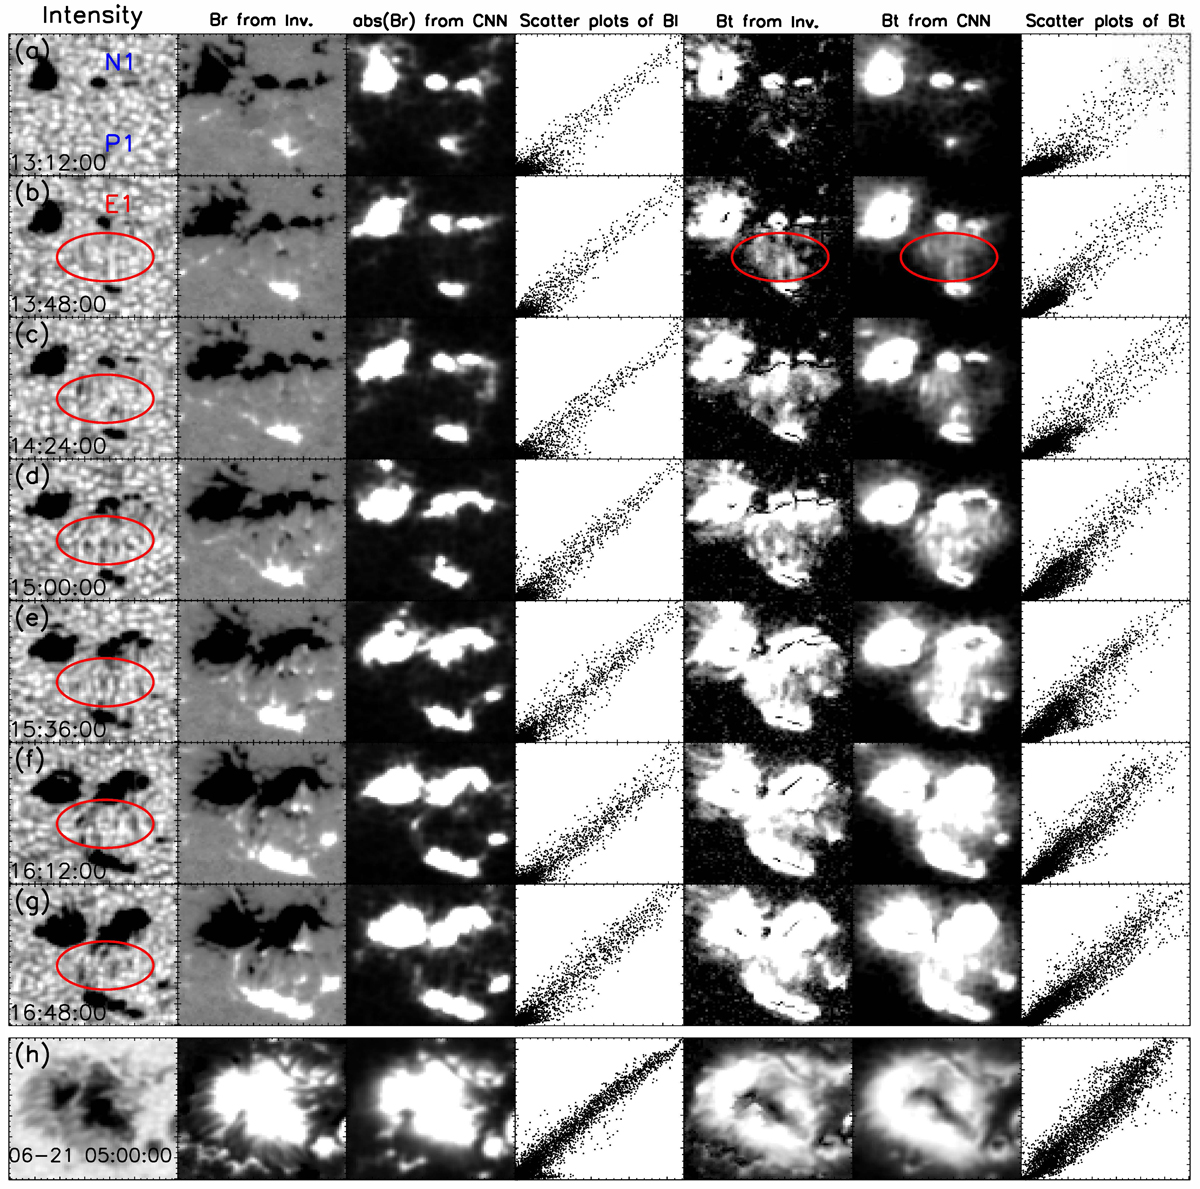
Fig. 3.
Download original image
Evolution of the Region R1 in Fig. 2a from 13:12 to 17:24 UT (panels a–g). The columns from left to right are, in order, the continuum images, Br from Stokes inversion, |Br| from CNN model, scatter plots of |Br| between the two methods, Bt from Stokes inversion and CNN model, and scatter plots of the two methods, respectively. The elliptical E1 indicates the region where the transverse magnetic field emerges. Panel h: values for a sunspot from R3 region but for a different time.
Current usage metrics show cumulative count of Article Views (full-text article views including HTML views, PDF and ePub downloads, according to the available data) and Abstracts Views on Vision4Press platform.
Data correspond to usage on the plateform after 2015. The current usage metrics is available 48-96 hours after online publication and is updated daily on week days.
Initial download of the metrics may take a while.