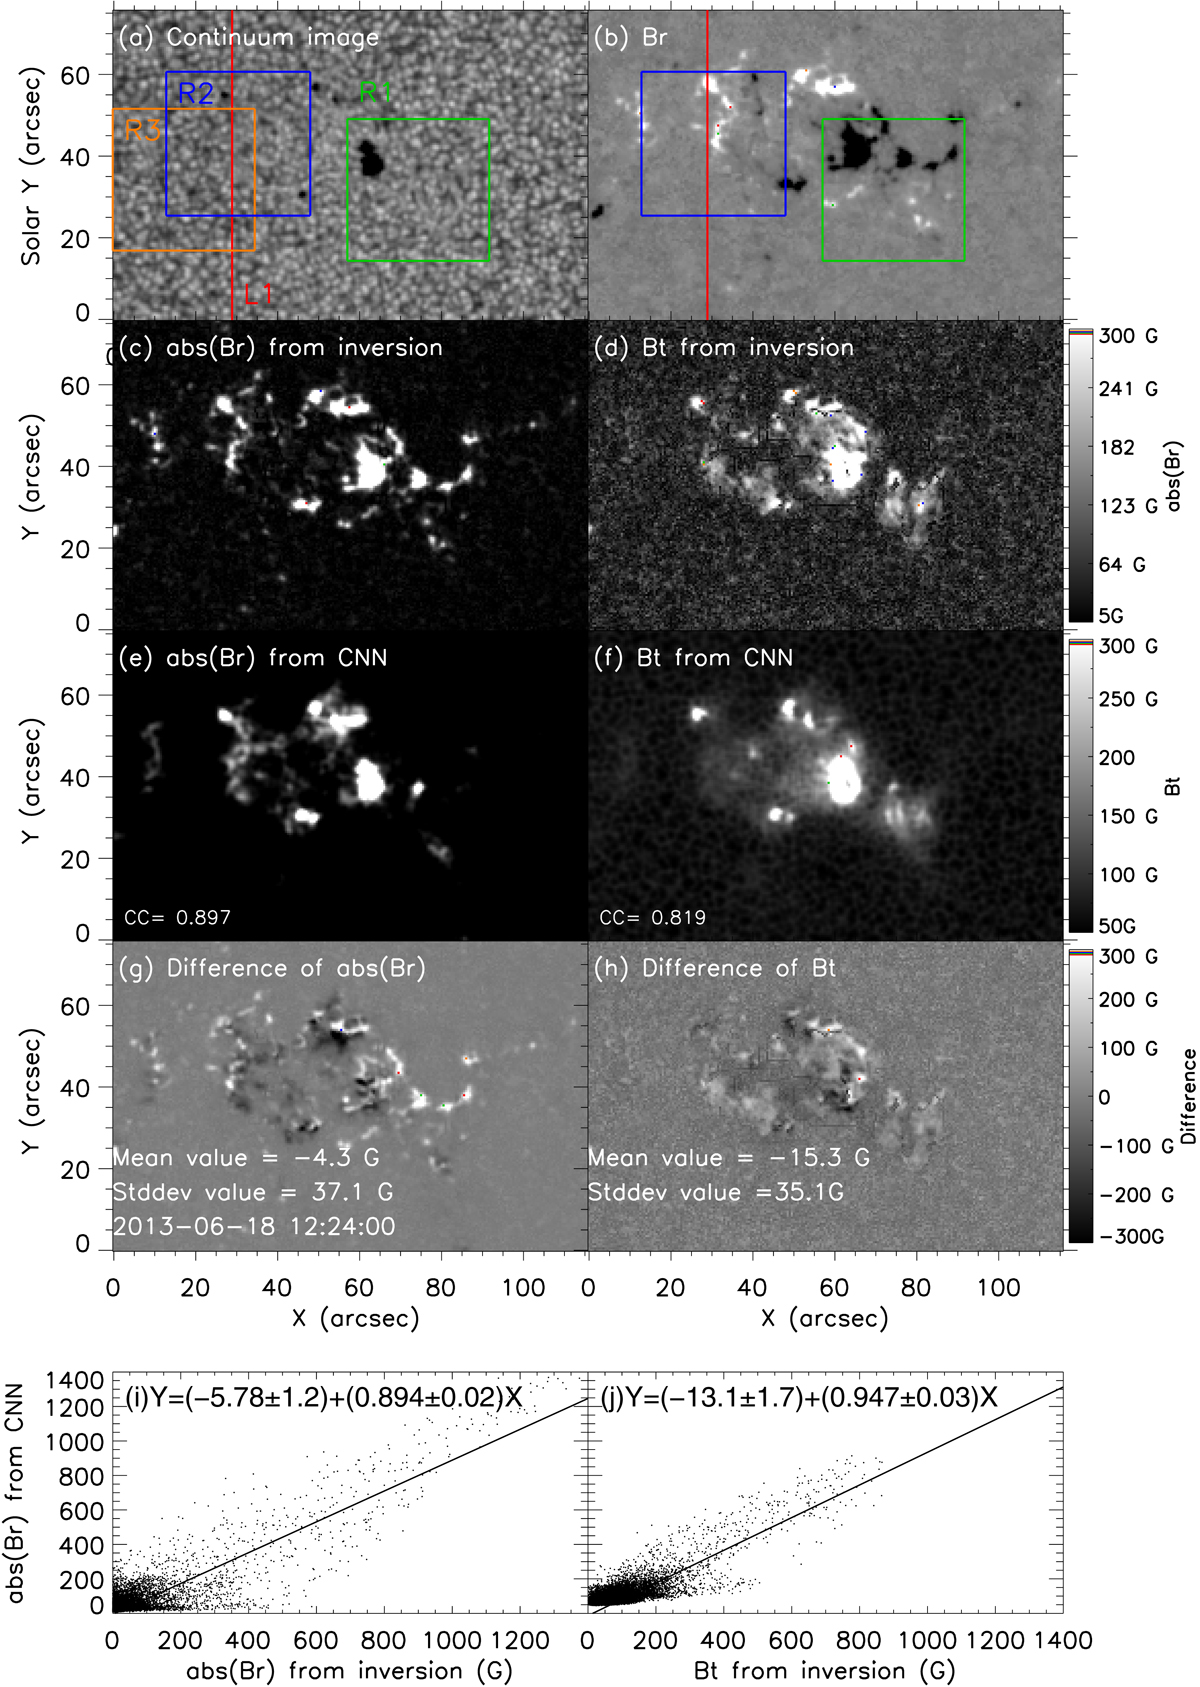
Fig. 2.
Download original image
Result from SHARP No. 2875. Panels a–d: image of continuum, Br, |Br|, and Bt from Stokes inversion, respectively. Panels e and f: |Br| and Bt estimated from panel a with the trained CNN model. Panel g is the difference map of |Br| between Stokes inversion and the CNN model, while panel h is that of Bt. Panels i and j: scatter plots of |Br| and Bt between the two methods. Regions R1 and R3 indicate the region used in Fig. 3. Region R2 and red line L1 are used in Fig. 4. An associated animation of these panels is available online.
Current usage metrics show cumulative count of Article Views (full-text article views including HTML views, PDF and ePub downloads, according to the available data) and Abstracts Views on Vision4Press platform.
Data correspond to usage on the plateform after 2015. The current usage metrics is available 48-96 hours after online publication and is updated daily on week days.
Initial download of the metrics may take a while.