Fig. 9.
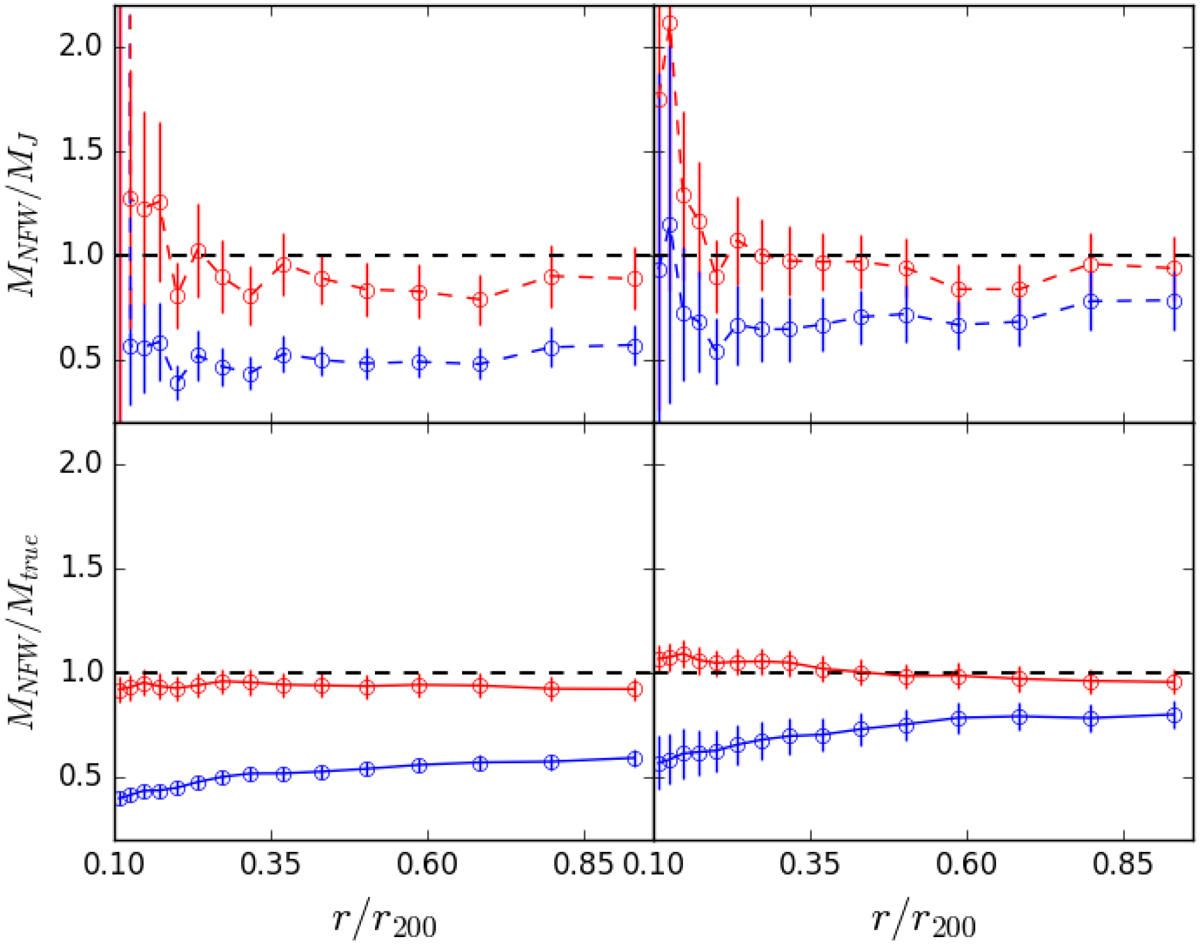
Ratio of different mass profile determinations obtained using red and blue galaxies as tracers, separately, for the C sample. Top panels: ratio of the median MNFW(r) obtained using red and blue galaxies (red and blue symbols, respectively) and MJeans(r). Bottom panels: same as top panel but with Mtrue in lieu of MJeans. Left and right panels: results obtained on the DLB07 and GAEA samples, respectively.
Current usage metrics show cumulative count of Article Views (full-text article views including HTML views, PDF and ePub downloads, according to the available data) and Abstracts Views on Vision4Press platform.
Data correspond to usage on the plateform after 2015. The current usage metrics is available 48-96 hours after online publication and is updated daily on week days.
Initial download of the metrics may take a while.