Fig. 6.
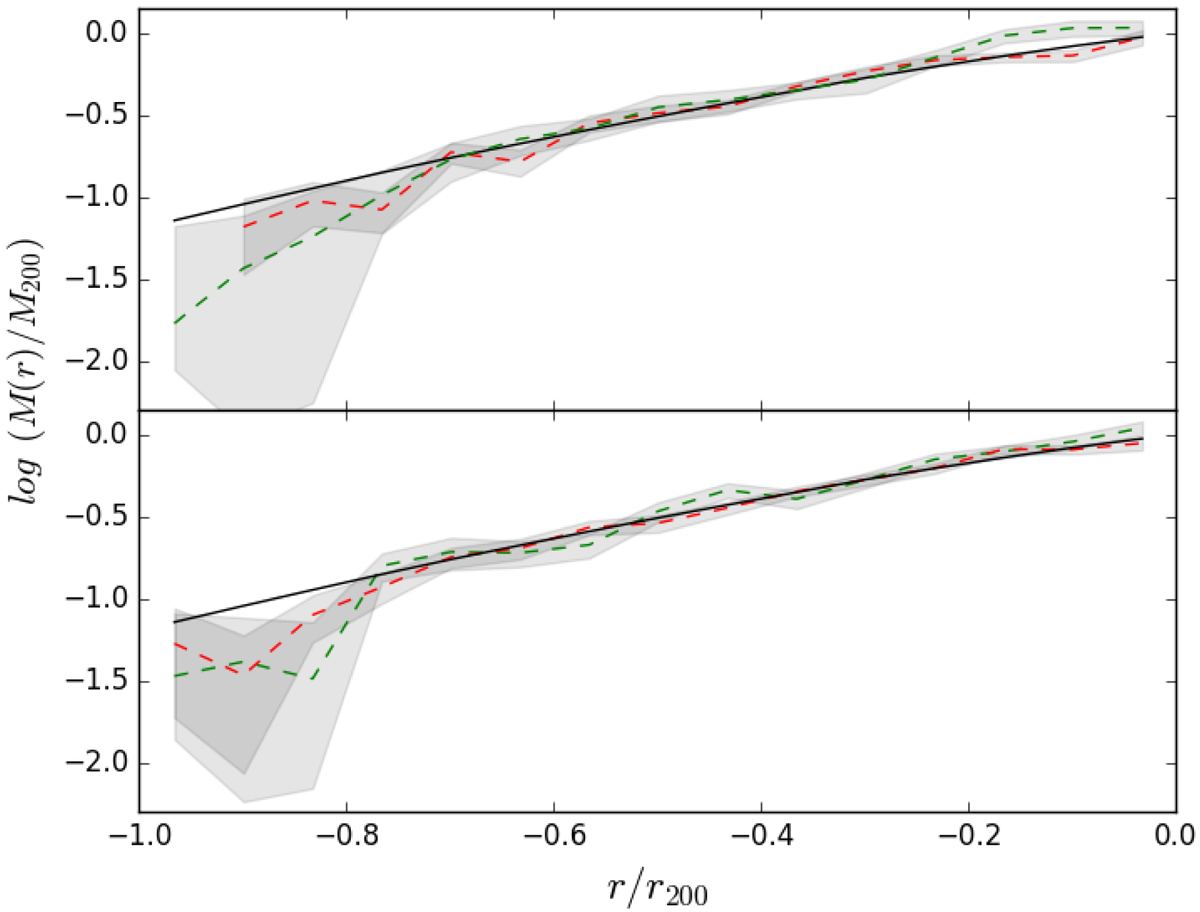
Mass profiles for prolate and oblate clusters. The median Mtrue(r) of all clusters is represented by the solid black curve, the median MJ(r) for prolate clusters is represented by the dashed red curve and the median MJ(r) for oblate clusters by dashed green curve. Shaded regions represent error bars ![]() . Top panel: clisters in the DLB07 sample. Bottom panel: clusters in the GAEA sample.
. Top panel: clisters in the DLB07 sample. Bottom panel: clusters in the GAEA sample.
Current usage metrics show cumulative count of Article Views (full-text article views including HTML views, PDF and ePub downloads, according to the available data) and Abstracts Views on Vision4Press platform.
Data correspond to usage on the plateform after 2015. The current usage metrics is available 48-96 hours after online publication and is updated daily on week days.
Initial download of the metrics may take a while.