Fig. 4.
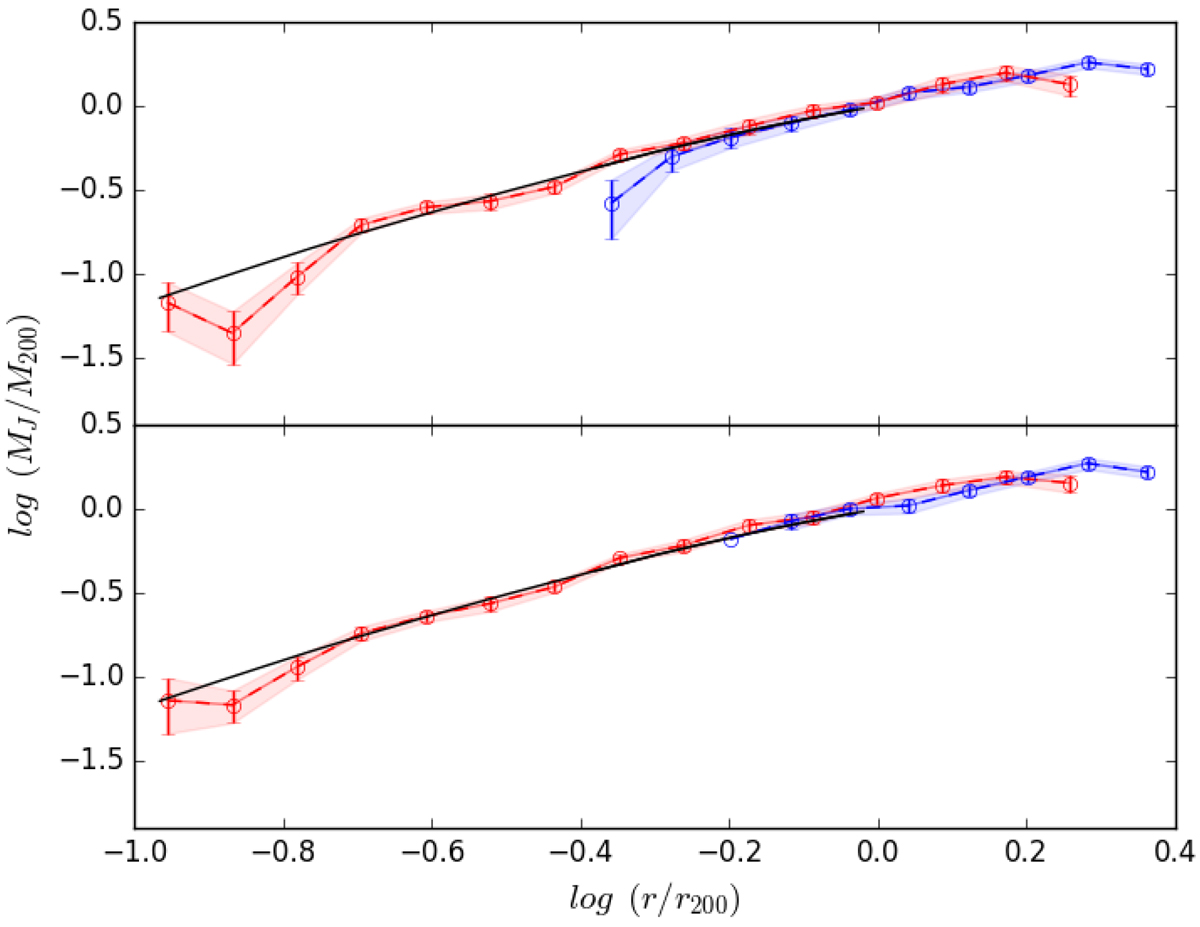
Median of 100 cluster MJ and its uncertainty obtained using red galaxies (red points with error bars and line) or blue galaxies (blue points with error bars and line) as tracers of the gravitational potential, compared to Mtrue(r) (black line). Top panel: clusters from the DLB07 sample. Bottom panel: clusters from the GAEA sample.
Current usage metrics show cumulative count of Article Views (full-text article views including HTML views, PDF and ePub downloads, according to the available data) and Abstracts Views on Vision4Press platform.
Data correspond to usage on the plateform after 2015. The current usage metrics is available 48-96 hours after online publication and is updated daily on week days.
Initial download of the metrics may take a while.