Fig. 17.
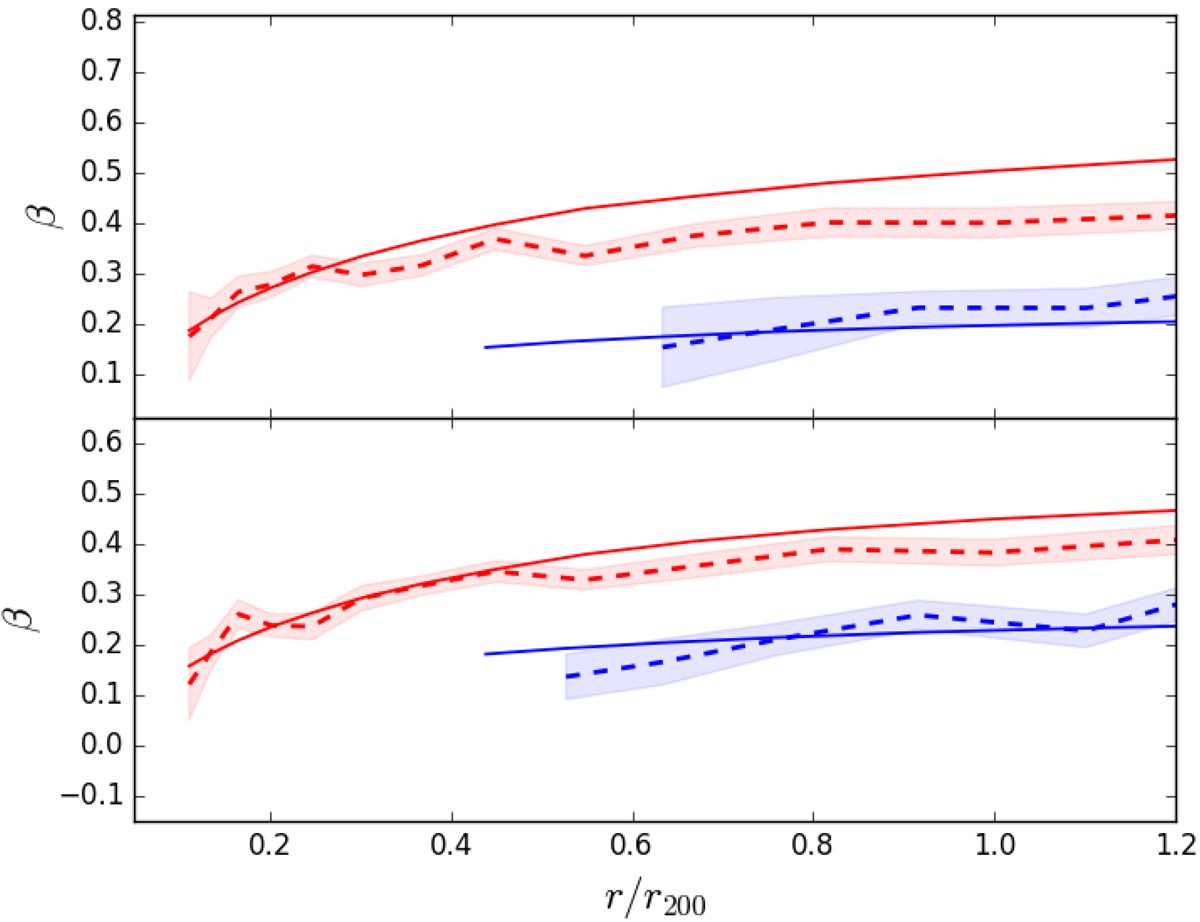
MAMPOSSt β(r) estimates for red (dashed red curve and ![]() confidence level) and blue (dashed blue curve and
confidence level) and blue (dashed blue curve and ![]() confidence level) galaxies in the C sample, compared to the true β(r), median of 100 clusters along three orthogonal projections (solid curves with corresponding colors). Top panel: DLB07 sample. Bottom panel: GAEA sample.
confidence level) galaxies in the C sample, compared to the true β(r), median of 100 clusters along three orthogonal projections (solid curves with corresponding colors). Top panel: DLB07 sample. Bottom panel: GAEA sample.
Current usage metrics show cumulative count of Article Views (full-text article views including HTML views, PDF and ePub downloads, according to the available data) and Abstracts Views on Vision4Press platform.
Data correspond to usage on the plateform after 2015. The current usage metrics is available 48-96 hours after online publication and is updated daily on week days.
Initial download of the metrics may take a while.