Fig. 15.
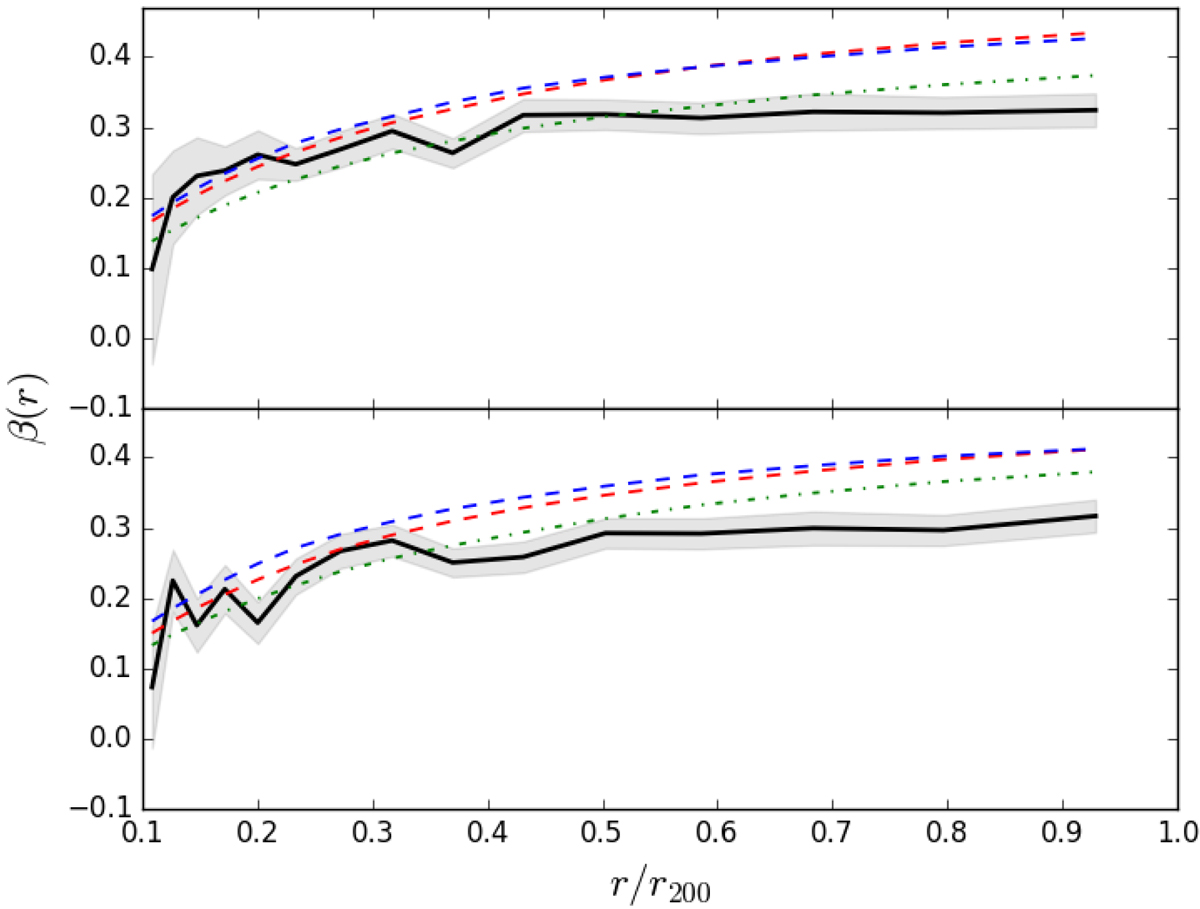
Median β(r) for three orthogonal projections of 100 clusters, as obtained by the MAMPOSSt analysis, for the C (dashed red line), RM (green line), and C100 (blue line) samples. The solid black line and shaded region indicate the β(r) and shaded region the uncertainty ![]() , obtained from full phase-space information. Top panel: DLB07 sample. Bottom panel: GAEA sample.
, obtained from full phase-space information. Top panel: DLB07 sample. Bottom panel: GAEA sample.
Current usage metrics show cumulative count of Article Views (full-text article views including HTML views, PDF and ePub downloads, according to the available data) and Abstracts Views on Vision4Press platform.
Data correspond to usage on the plateform after 2015. The current usage metrics is available 48-96 hours after online publication and is updated daily on week days.
Initial download of the metrics may take a while.