Fig. 4.
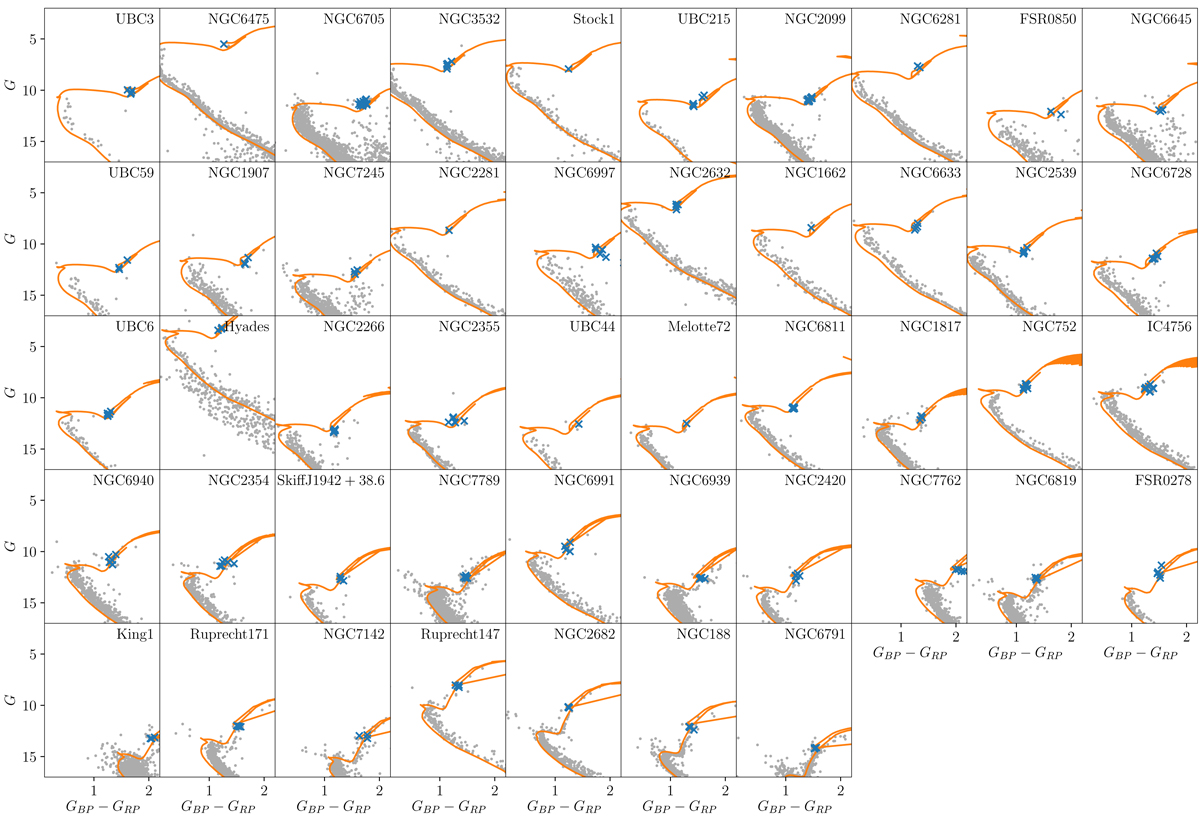
Gaia DR2 color-magnitude diagrams of the sample of clusters used (sorted by age), retained RC targets are marked with a blue cross. The gray points correspond to the membership selections by Cantat-Gaudin et al. (2018); Gaia Collaboration (2018a). PARSEC isochrones (Marigo et al. 2017) of the corresponding metallicity computed in this paper are overplotted using distances provided by CG20, and ages and extinctions detailed in Sect. 4.
Current usage metrics show cumulative count of Article Views (full-text article views including HTML views, PDF and ePub downloads, according to the available data) and Abstracts Views on Vision4Press platform.
Data correspond to usage on the plateform after 2015. The current usage metrics is available 48-96 hours after online publication and is updated daily on week days.
Initial download of the metrics may take a while.