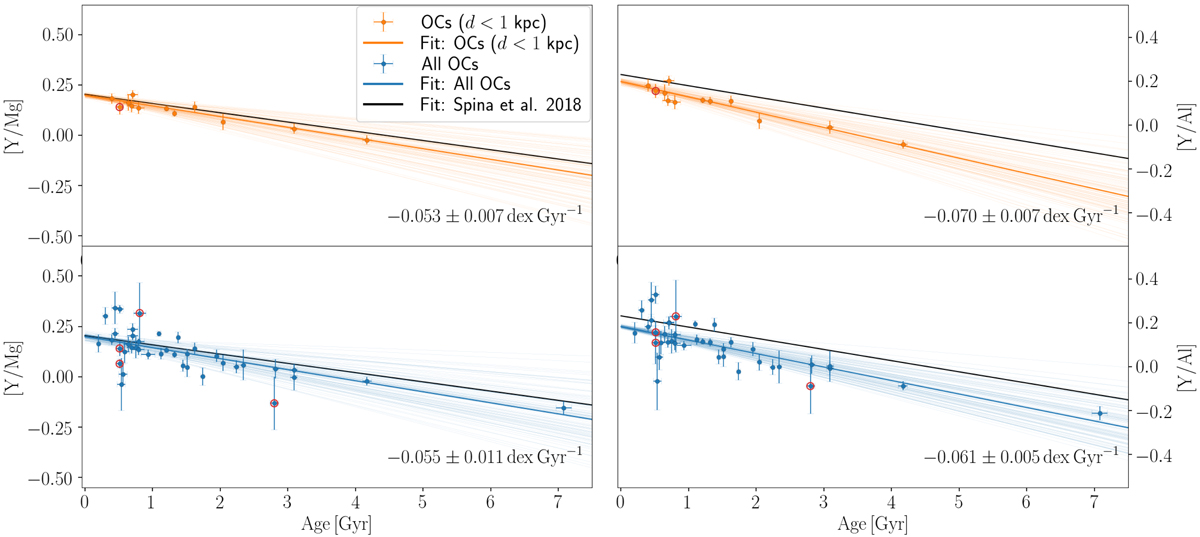
Fig. 12.

[Y/Mg] (left) and [Y/Al] (right) abundances of our sample of clusters (with more than one measured star) as a function of age. In the top panel we plot the clusters closer than 1 kpc (orange), and in the bottom panel clusters at all distances. The clusters marked with red circles are those flagged in Sect. 2.4. The linear fits done for the close (all) clusters are plotted in orange (blue) lines, accounting for uncertainties. The values of the obtained slopes are indicated. The results of the linear fit performed by Spina et al. (2018) are shown in black for comparison purposes.
Current usage metrics show cumulative count of Article Views (full-text article views including HTML views, PDF and ePub downloads, according to the available data) and Abstracts Views on Vision4Press platform.
Data correspond to usage on the plateform after 2015. The current usage metrics is available 48-96 hours after online publication and is updated daily on week days.
Initial download of the metrics may take a while.


