Fig. 11.
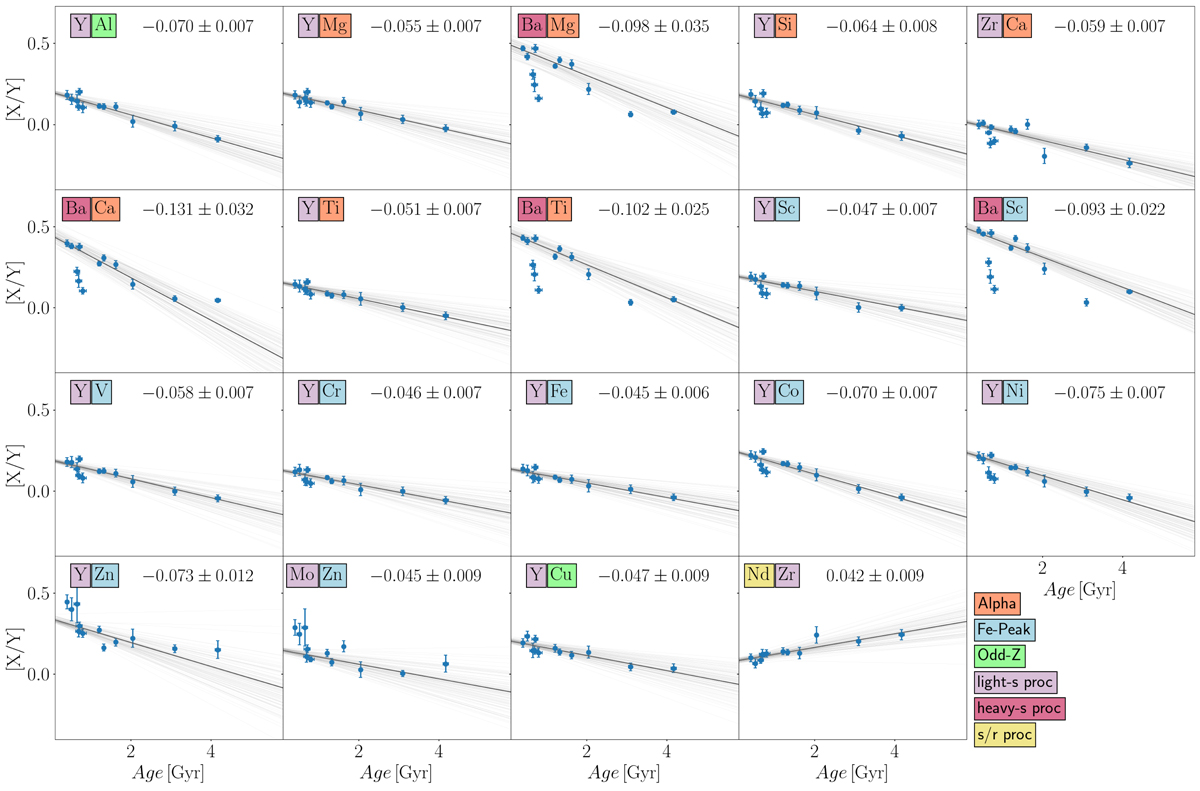
Abundance ratios for which a significant level of correlation is found. Only clusters closer than 1 kpc and with more than one star are plotted. Error bars for the x-axis are usually smaller than the point size. The best-fit model is overplotted in black (the resulting slope written in each panel in dex Gyr−1), and the light gray lines correspond to the sampling of the MCMC. Element names are colored depending on the chemical family they belong to.
Current usage metrics show cumulative count of Article Views (full-text article views including HTML views, PDF and ePub downloads, according to the available data) and Abstracts Views on Vision4Press platform.
Data correspond to usage on the plateform after 2015. The current usage metrics is available 48-96 hours after online publication and is updated daily on week days.
Initial download of the metrics may take a while.