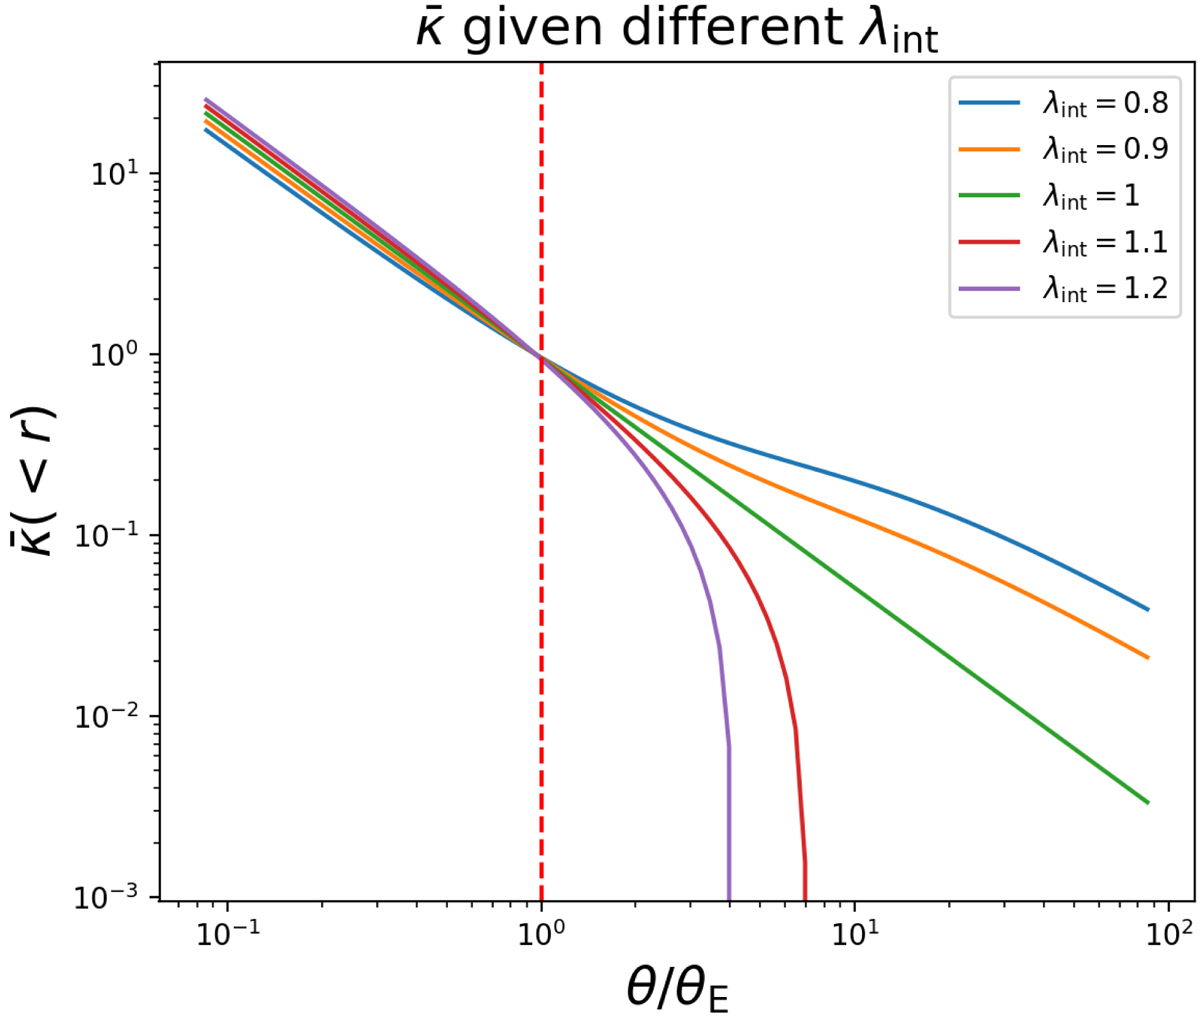
Fig. 1.

Illustration of the transformed power-law profile in the mean dimensionless enclosed projected mass distribution under the internal MST with θs = 10″. All the transformed mass profiles share the same Einstein radius (red dashed line). All the mass distributions in this figure produce essentially the same model images (i.e., the difference of the χ2 is less than 0.001%) but a different unlensed size of the source, which is not directly observable.
Current usage metrics show cumulative count of Article Views (full-text article views including HTML views, PDF and ePub downloads, according to the available data) and Abstracts Views on Vision4Press platform.
Data correspond to usage on the plateform after 2015. The current usage metrics is available 48-96 hours after online publication and is updated daily on week days.
Initial download of the metrics may take a while.


