Fig. 3.
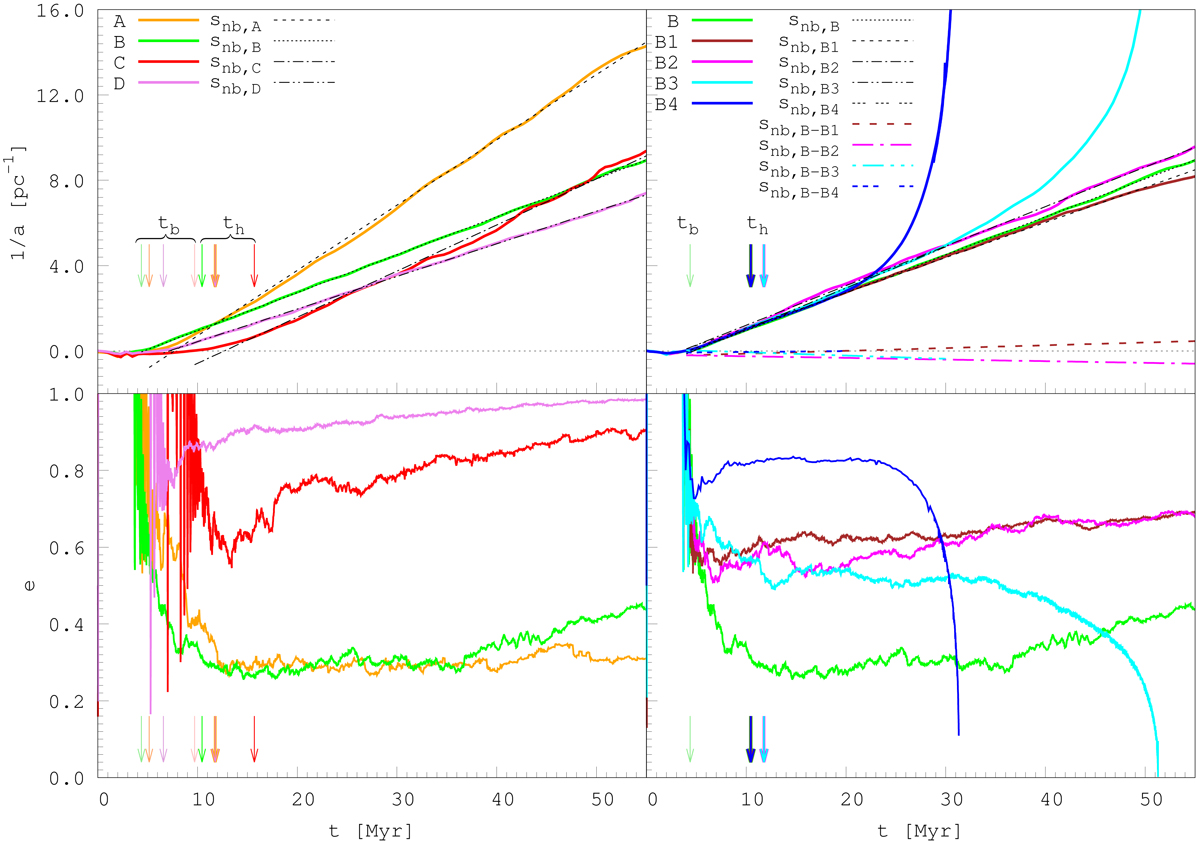
From top to bottom: evolution of inverse semimajor axis and eccentricity in the pure N-body regime for physical models A, B, C, and D (left) and numerical models B1-4 (right) based on physical model B. It is worth noting that for numerical models B3 and B4 we turned on PN terms from the start of simulations. For numerical models, residuals between model B and models B1-4 are shown as colored dashed lines. Colored arrows mark the time when each system becomes bound tb (pale color) and then hard th (intense color). Colors were chosen according to the main color scheme for each model.
Current usage metrics show cumulative count of Article Views (full-text article views including HTML views, PDF and ePub downloads, according to the available data) and Abstracts Views on Vision4Press platform.
Data correspond to usage on the plateform after 2015. The current usage metrics is available 48-96 hours after online publication and is updated daily on week days.
Initial download of the metrics may take a while.