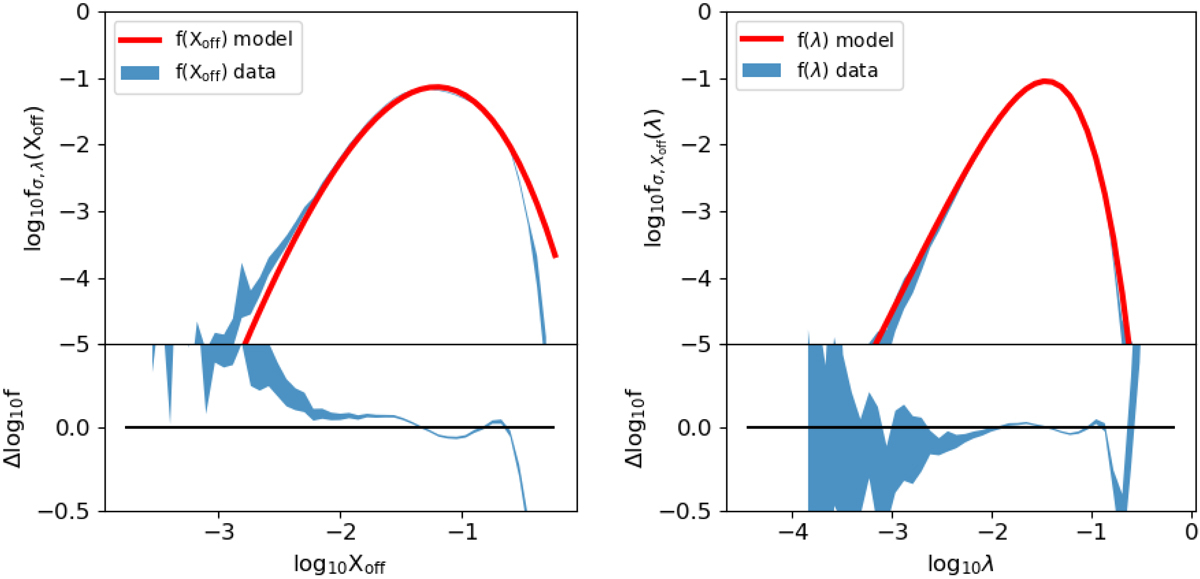
Fig. 9.
Download original image
Comparison between data and model of fσ, λ(Xoff) and fσ, Xoff(λ). Top panels: the straight red lines indicate the integral on the best-fit model, while the shaded blue areas represent the integral on the 3d h(σ, Xoff, λ) data with 1σ uncertainties. Each bottom panel shows the residual trend with σ error; the straight black line represents the perfect match between data and model with null residual. Top left panel: f(Xoff) as a function of Xoff. Bottom left panel: residual between fσ, λ(Xoff) data and model in logarithmic scale. Top right panel: f(λ) as a function of λ. Bottom right panel: residual between fσ, Xoff(λ) data, and model in logarithmic scale.
Current usage metrics show cumulative count of Article Views (full-text article views including HTML views, PDF and ePub downloads, according to the available data) and Abstracts Views on Vision4Press platform.
Data correspond to usage on the plateform after 2015. The current usage metrics is available 48-96 hours after online publication and is updated daily on week days.
Initial download of the metrics may take a while.