Fig. 7.
Download original image
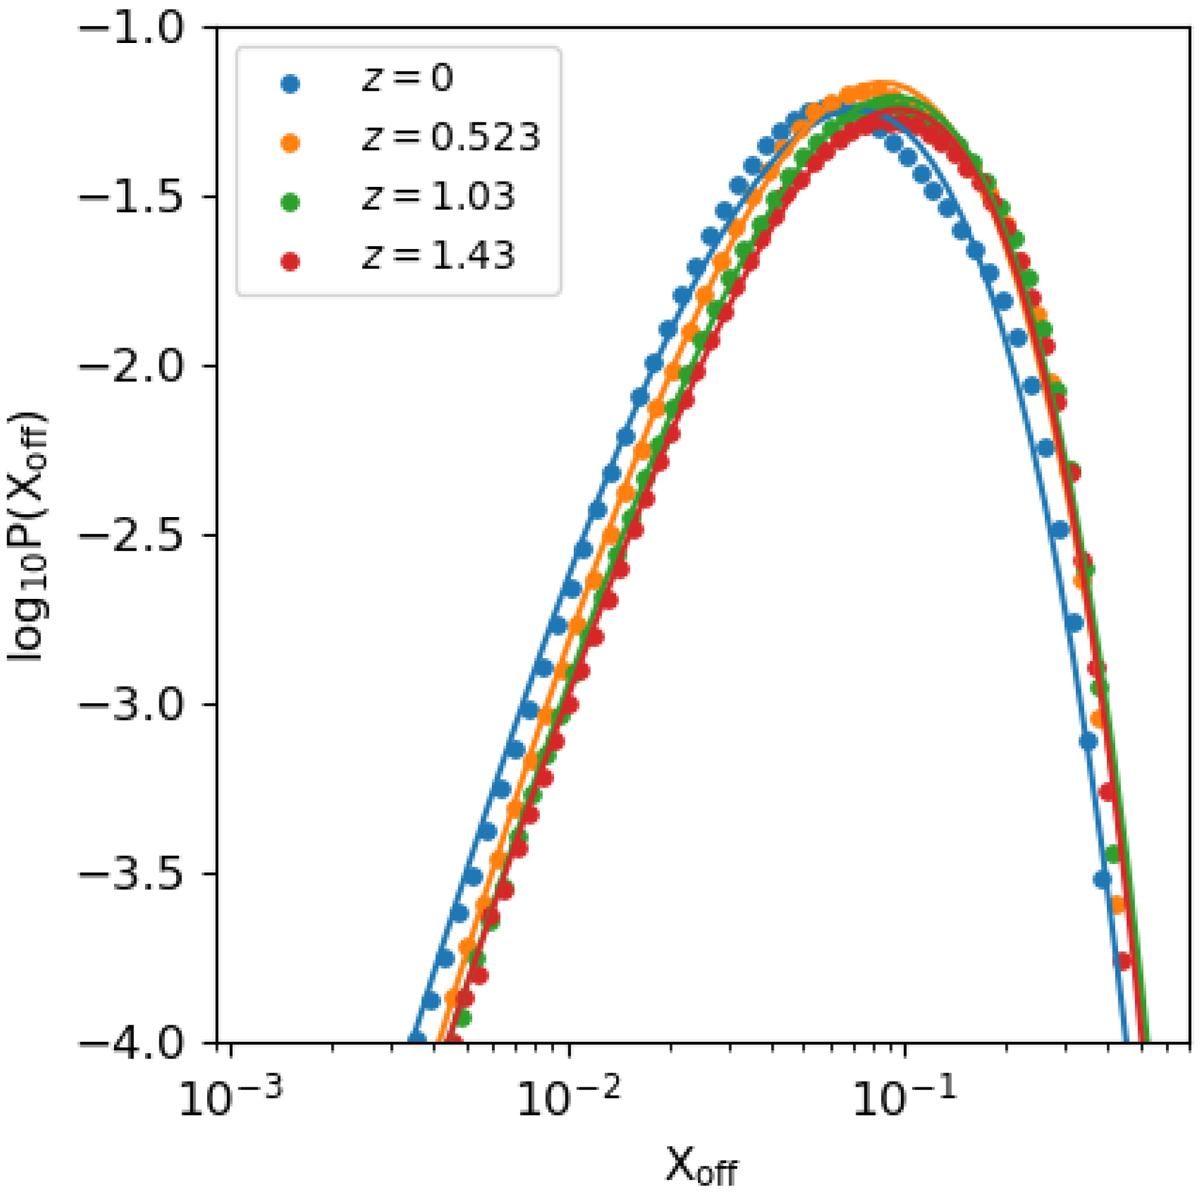
Probability density function of Xoff. Each panel shows the distribution at a specific redshift. Scatter points indicate the data, while straight lines represent the modified Schechter model. The samples are color-coded by redshift. Each redshift slice is fitted independently by Eq. (14). The best-fit parameters are given in Table A.3.
Current usage metrics show cumulative count of Article Views (full-text article views including HTML views, PDF and ePub downloads, according to the available data) and Abstracts Views on Vision4Press platform.
Data correspond to usage on the plateform after 2015. The current usage metrics is available 48-96 hours after online publication and is updated daily on week days.
Initial download of the metrics may take a while.