Open Access
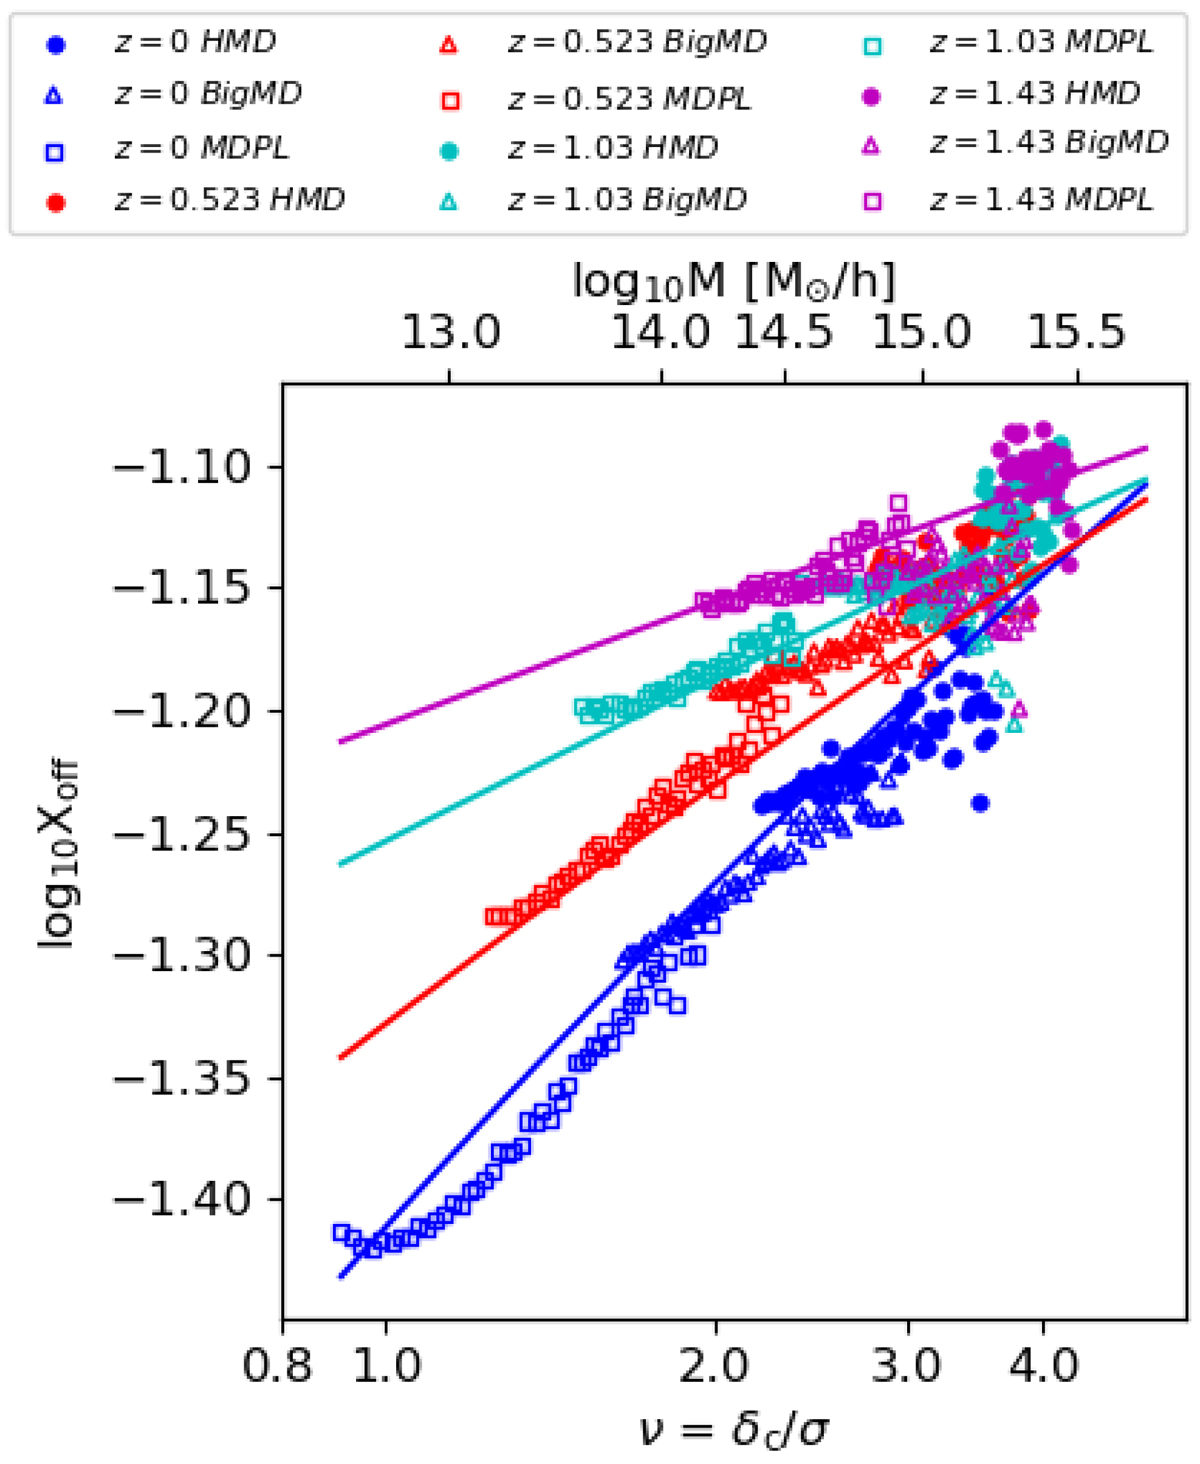
Fig. 6.
Download original image
Offset–mass relation (Xoff–σ, Eq. (13)). Circular dots, triangles, and squares represent HMD, BIGMD, and MDPL2 respectively. They are color-coded by redshift. Straight lines show the best-fit model. The best-fit parameters are given in Table A.3. The upper x-axis converts peaks values into mass at z = 0.
Current usage metrics show cumulative count of Article Views (full-text article views including HTML views, PDF and ePub downloads, according to the available data) and Abstracts Views on Vision4Press platform.
Data correspond to usage on the plateform after 2015. The current usage metrics is available 48-96 hours after online publication and is updated daily on week days.
Initial download of the metrics may take a while.