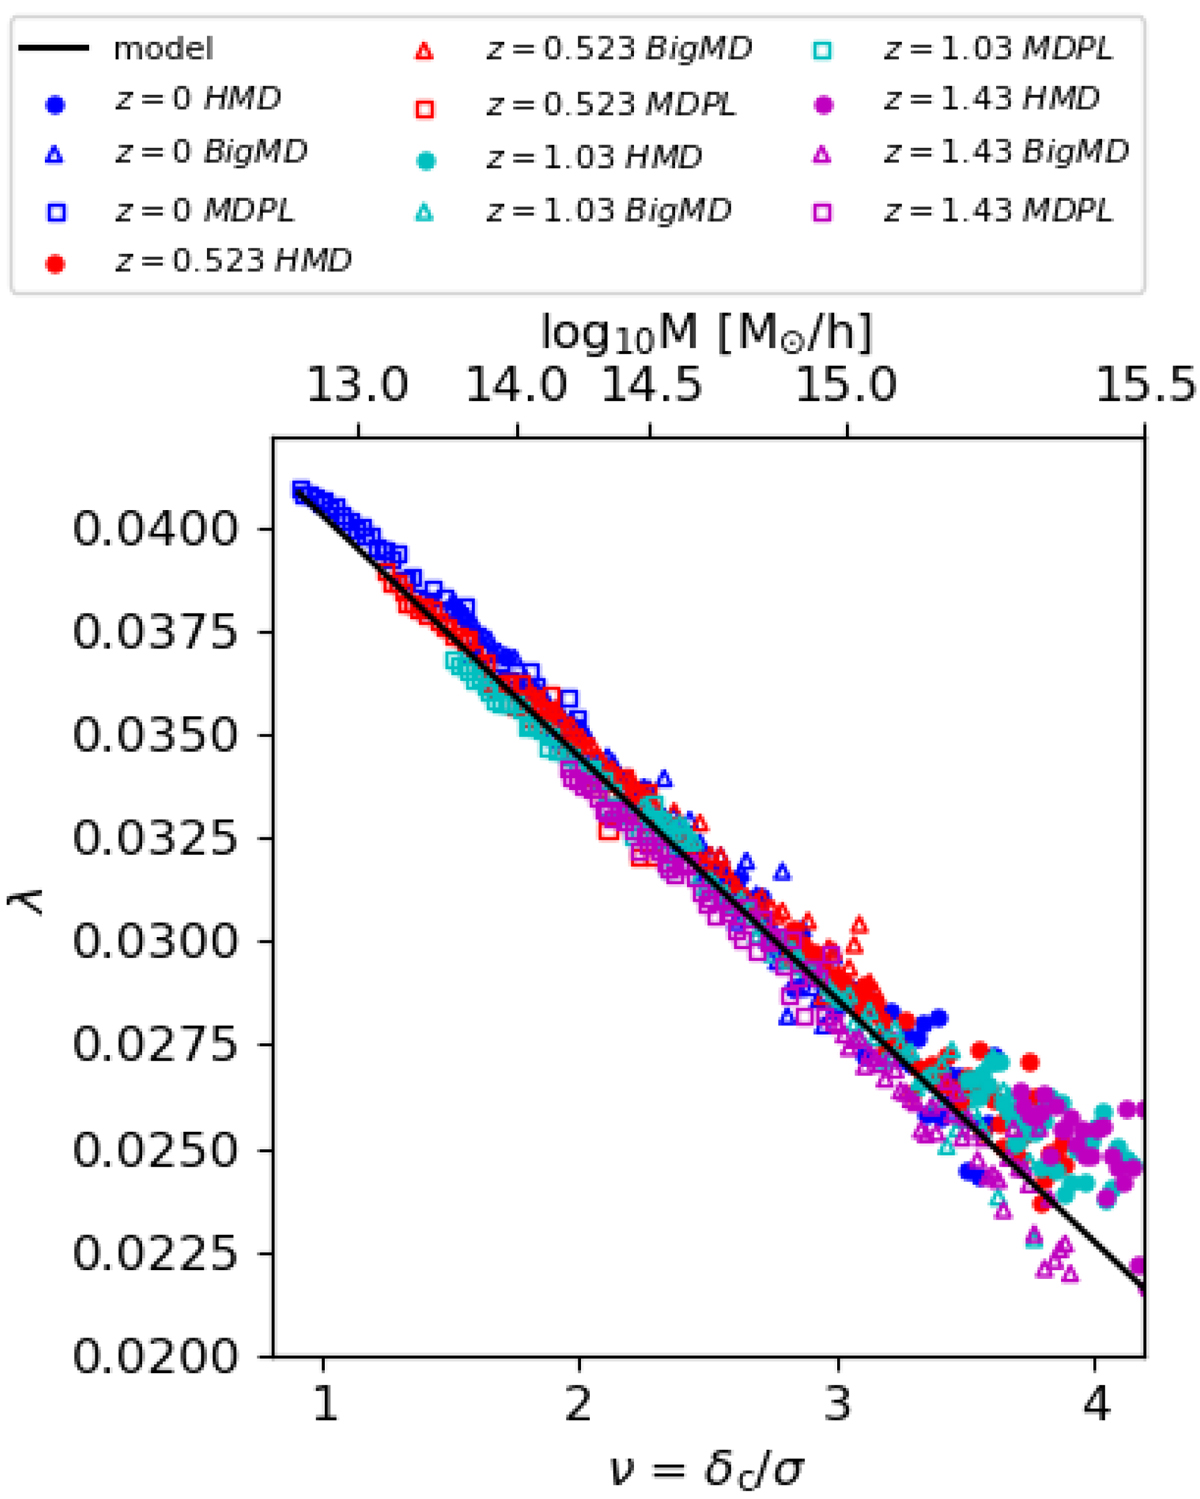
Fig. 4.
Download original image
Spin–mass relation (λ-σ, Eq. (11)). The model is a linear relation with no redshift trend. Data points are color-coded by redshift, while the different geometrical shapes refer to different simulations: squares for HMD, triangles for BigMD, and circles for MDPL. The straight line indicates the best-fit model, which considers all simulations and redshift at the same time. The best-fit parameters are given in Table A.2. The upper x-axis converts peaks values into mass at z = 0.
Current usage metrics show cumulative count of Article Views (full-text article views including HTML views, PDF and ePub downloads, according to the available data) and Abstracts Views on Vision4Press platform.
Data correspond to usage on the plateform after 2015. The current usage metrics is available 48-96 hours after online publication and is updated daily on week days.
Initial download of the metrics may take a while.