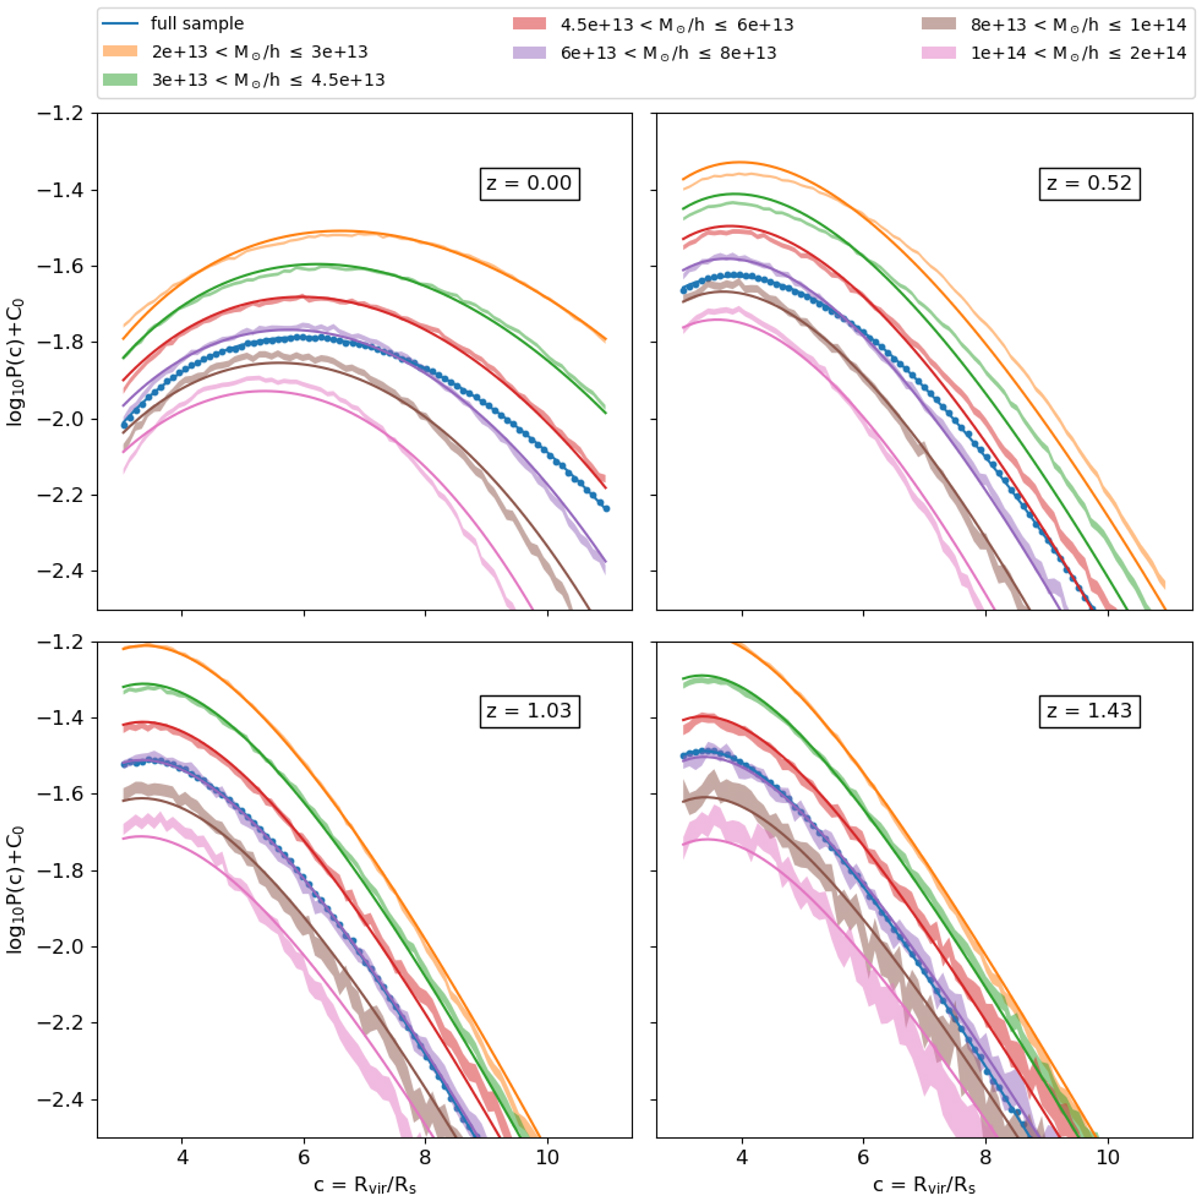
Fig. 3.
Download original image
Probability density function of the concentration (Eq. (10)) at the different redshifts values given in each panel. Each set is divided into mass slices, and is color-coded accordingly. The shaded areas represent the data with 1σ error, while the straight lines indicate the best-fit model. The blue points and line represent the total sample not sliced in mass. For clarity, each line and its fit is shifted by 0.1 dex on the y-axis. This means that the constant C0 assumes values of (+0.3, +0.2, +0.1, 0.0, −0.1, −0.2). The purple line is not shifted, and is thus the one with the proper normalization.
Current usage metrics show cumulative count of Article Views (full-text article views including HTML views, PDF and ePub downloads, according to the available data) and Abstracts Views on Vision4Press platform.
Data correspond to usage on the plateform after 2015. The current usage metrics is available 48-96 hours after online publication and is updated daily on week days.
Initial download of the metrics may take a while.