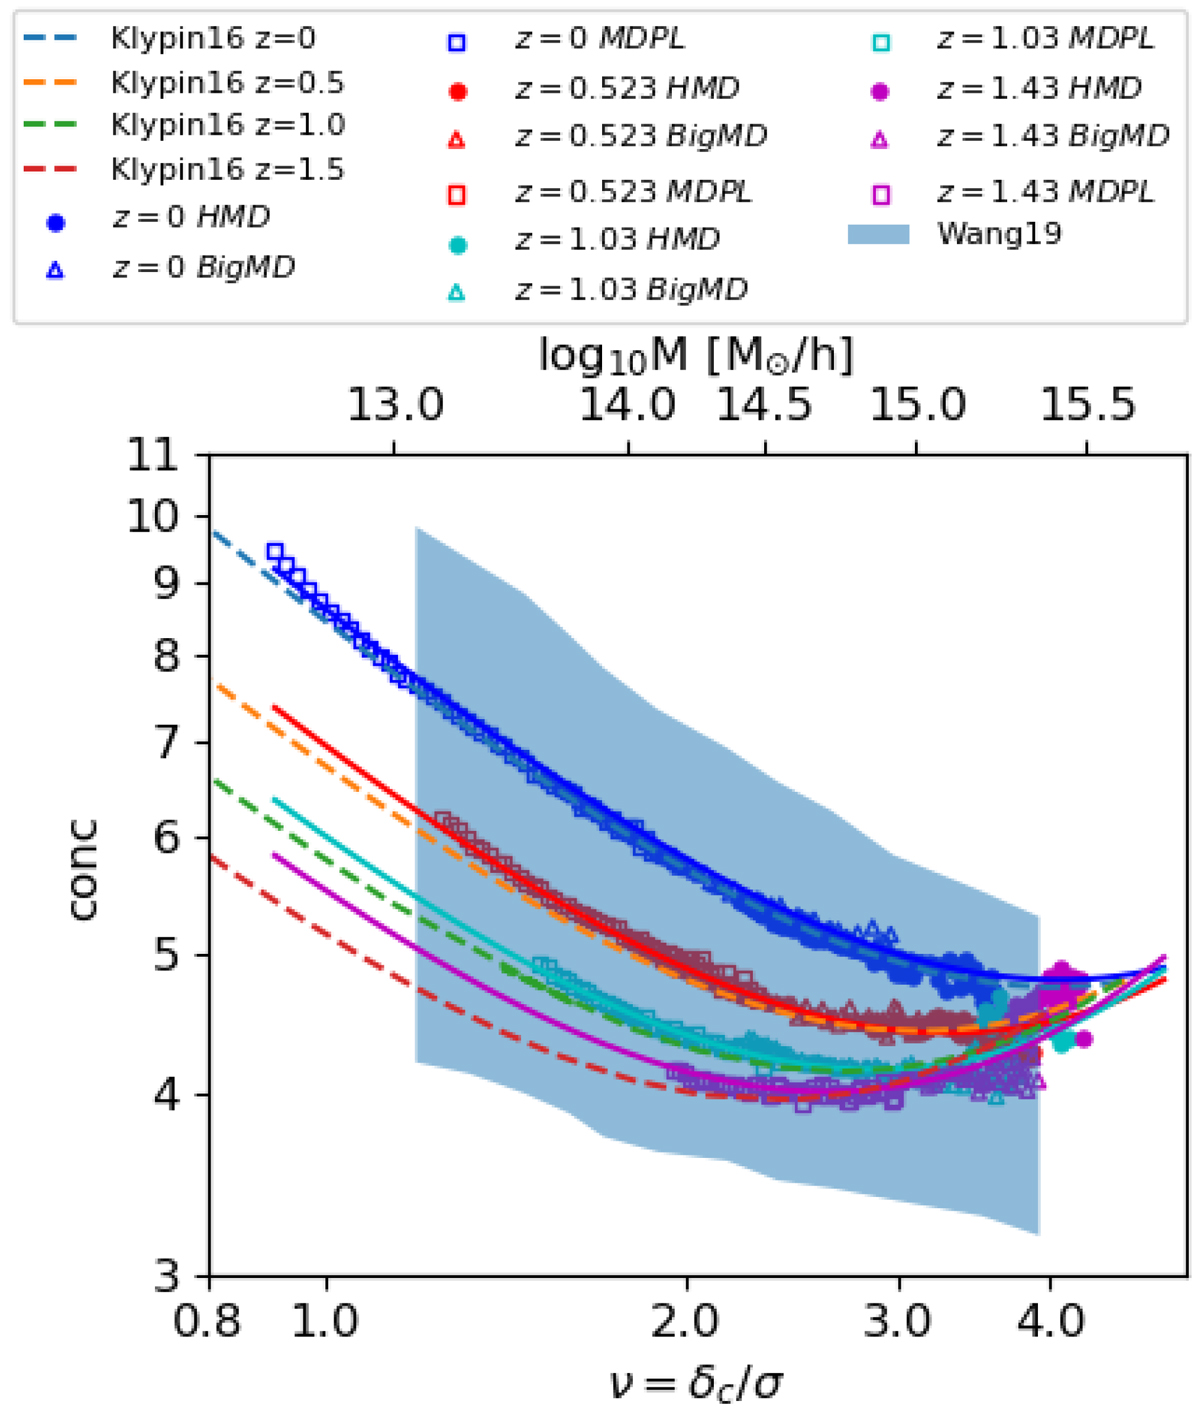
Fig. 2.
Download original image
Concentration–σ relation (Eq. (9)). Circular dots, triangles, and squares represent HMD, BIGMD, MDPL2, respectively. They are color-coded by redshift. Straight lines indicate our best-fit model, dotted lines show the model from Klypin et al. (2016), and the shaded blue area indicates the distribution from Wang et al. (2020) at z = 0. The upper x-axis converts peaks values into mass at z = 0.
Current usage metrics show cumulative count of Article Views (full-text article views including HTML views, PDF and ePub downloads, according to the available data) and Abstracts Views on Vision4Press platform.
Data correspond to usage on the plateform after 2015. The current usage metrics is available 48-96 hours after online publication and is updated daily on week days.
Initial download of the metrics may take a while.