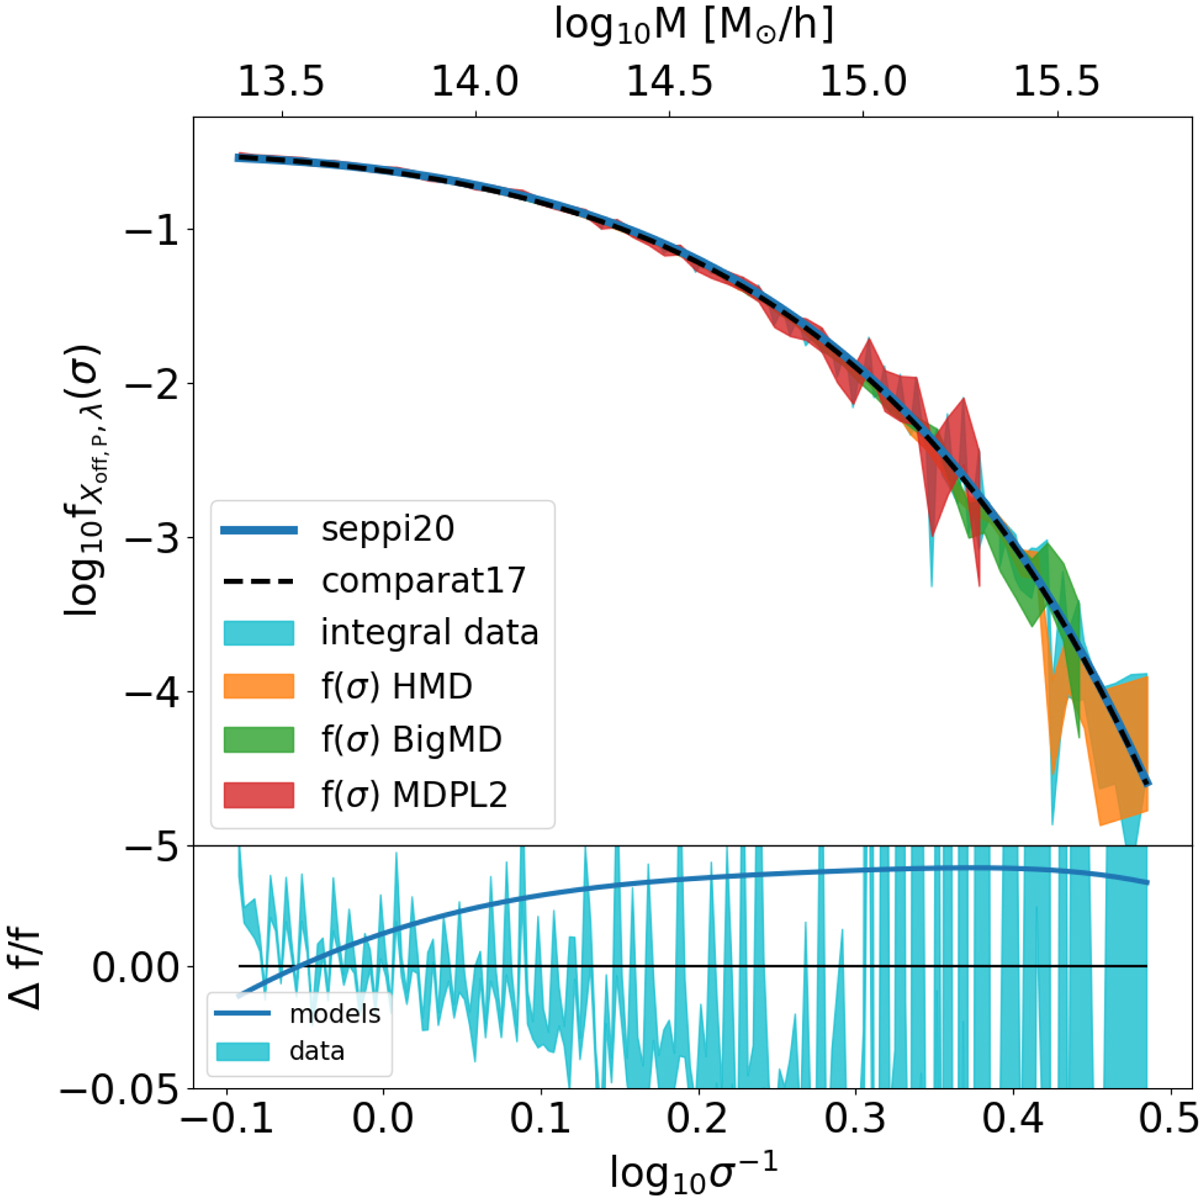
Fig. B.5.
Download original image
Comparison of multiplicty functions. Top panel: three shaded regions show the 1σ contours of f(σ) data directly computed on different simulations (orange for HMD, green for BIGMD, red for MDPL2); the light blue shaded region is the 1σ contour of the 2D integral computed on the concatenated sample containing all three simulations; the dashed pink line indicates the mass function from Comparat et al. (2017), while the blue solid line is the f(σ) we recover integrating our model along Xoff, P and λ. Bottom panel: blue thick line is the fractional difference between our f(σ) and the Comparat et al. (2017) value. The light blue shaded area represent the 1σ contours of the residual between the integrated data and our best-fit model; the black horizontal line indicates the perfect match with null residual.
Current usage metrics show cumulative count of Article Views (full-text article views including HTML views, PDF and ePub downloads, according to the available data) and Abstracts Views on Vision4Press platform.
Data correspond to usage on the plateform after 2015. The current usage metrics is available 48-96 hours after online publication and is updated daily on week days.
Initial download of the metrics may take a while.