Fig. B.2.
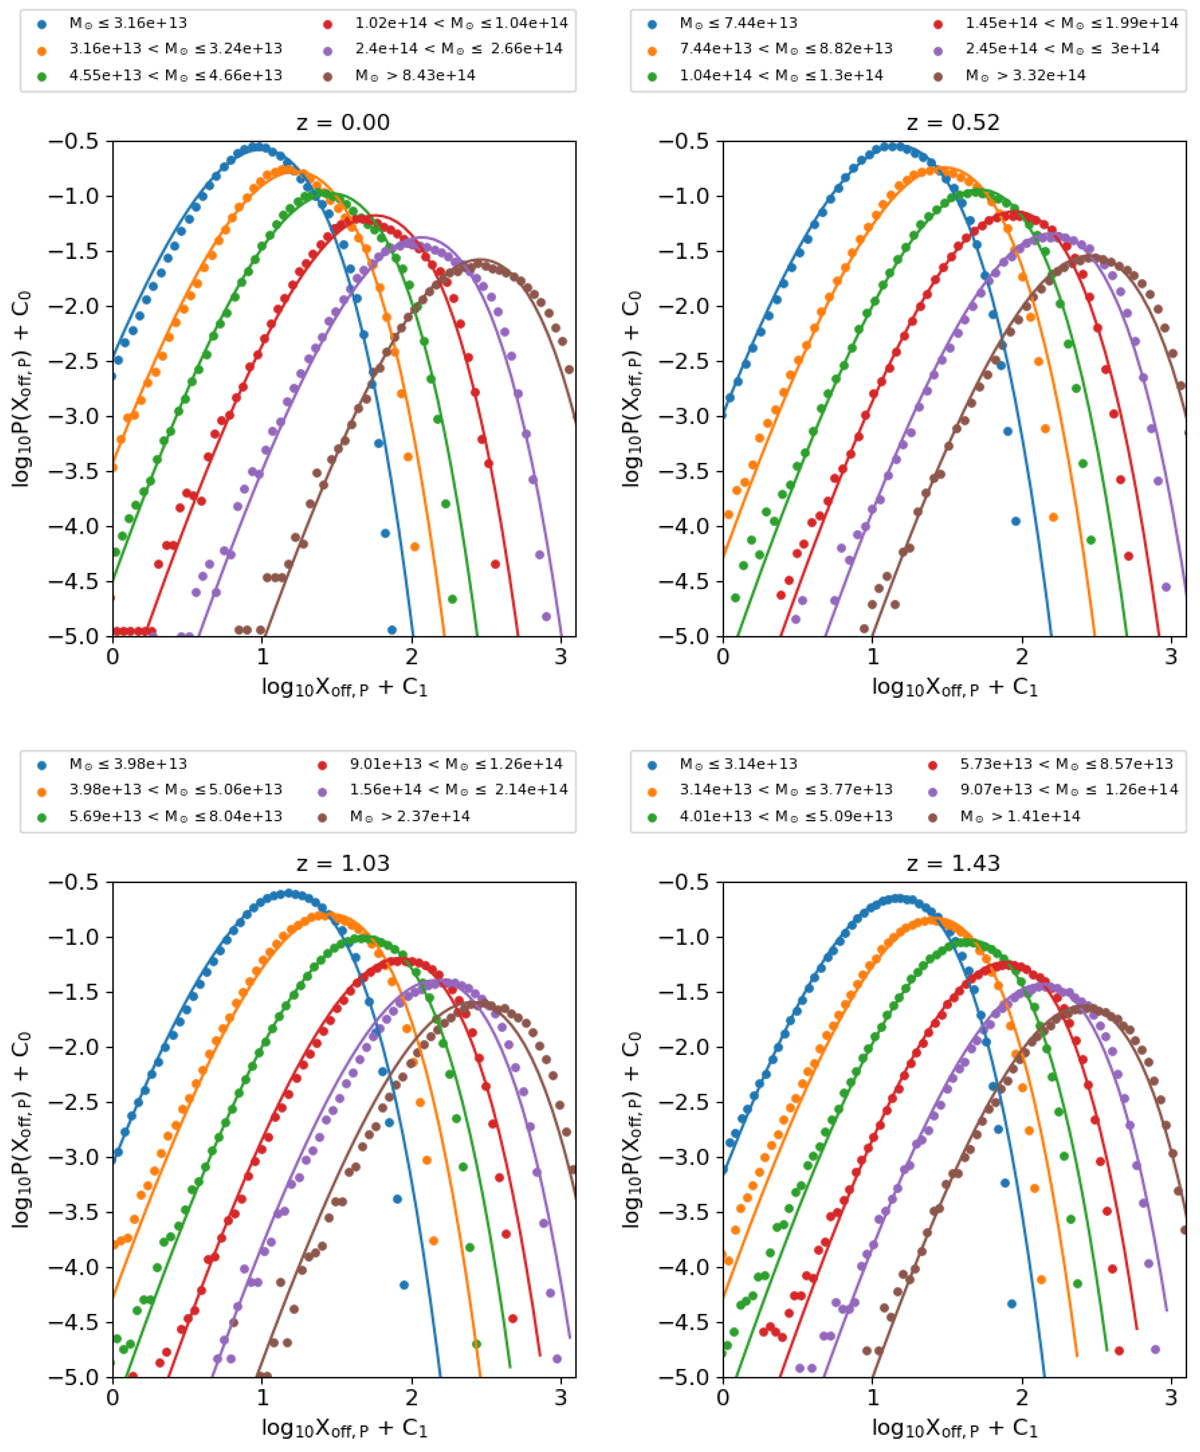
Download original image
Probability density function of Xoff, P (Eq. (B.2)). Each panel shows the distribution at a specific redshift. Each set is divided in mass slices, identified by color. Scatter points indicate the data, while straight lines represent the modified Schechter model (14). For clarity, each line and its fit are shifted by 0.2 dex along both axes. This means that the coefficient C0 assumes values ( + 0.6, +0.4, +0.2, 0.0, −0.2, −0.4), while C1 is ( − 0.6, −0.4, −0.2, 0.0, +0.2, +0.4). The red line is not shifted, and thus is the one with the correct normalization.
Current usage metrics show cumulative count of Article Views (full-text article views including HTML views, PDF and ePub downloads, according to the available data) and Abstracts Views on Vision4Press platform.
Data correspond to usage on the plateform after 2015. The current usage metrics is available 48-96 hours after online publication and is updated daily on week days.
Initial download of the metrics may take a while.