| Issue |
A&A
Volume 652, August 2021
|
|
|---|---|---|
| Article Number | C3 | |
| Number of page(s) | 2 | |
| Section | Cosmology (including clusters of galaxies) | |
| DOI | https://doi.org/10.1051/0004-6361/202038501e | |
| Published online | 03 August 2021 | |
Iron in X-COP: Tracing enrichment in cluster outskirts with high accuracy abundance profiles (Corrigendum)
1
INAF – Istituto di Astrofisica Spaziale e Fisica Cosmica di Milano, Via A. Corti 12, 20133 Milano, Italy
e-mail: This email address is being protected from spambots. You need JavaScript enabled to view it.
2
European Southern Observatory, Karl-Schwarzschild Str. 2, 85748 Garching bei Muenchen, Germany
3
INAF – Osservatorio Astronomico di Brera, via E. Bianchi 46, 23807 Merate, (LC), Italy
4
Institute of Fundamental Physics of the Universe, via Beirut 2, 34151 Grignano, Trieste, Italy
5
Harvard-Smithsonian Center for Astrophysics, 60 Garden St., Cambridge, MA 02138, USA
6
Universitäts-Sternwarte München, Scheinerstr. 1, 81679 München, Germany
7
Dipartimento di Fisica, Sezione di Astronomia, Università di Trieste, via Tiepolo 11, 34143 Trieste, Italy
8
INAF-Osservatorio Astronomico Trieste, via Tiepolo 11, 34123 Trieste, Italy
9
INFN, Instituto Nazionale di Fisica Nucleare, Trieste, Italy
10
Department of Astronomy, University of Geneva, ch. d’Ecogia 16, 1290 Versoix, Switzerland
11
INAF–Osservatorio di Astrofisica e Scienza dello Spazio di Bologna, via Piero Gobetti 93/3, 40129 Bologna, Italia
12
INFN, Sezione di Bologna, viale Berti Pichat 6/2, 40127 Bologna, Italy
13
Department of Astrophysical Sciences, Princeton University, 4 Ivy Lane, Princeton, NJ 08544, USA
14
Harvard-Smithsonian Center for Astrophysics, 60 Garden Street, Cambridge, MA 02138, USA
Key words: X-rays: galaxies: clusters / galaxies: clusters: general / galaxies: clusters: intracluster medium / large-scale structure of Universe / errata, addenda
Lyman Spitzer Jr. Fellow.
We discovered a conversion error in deriving the expected iron yield 𝒴Fe for Maoz & Graur (2017) values (see gold shaded area in our Fig. 19 in the original paper). Expected yields are evaluated through equation 12 and converted to solar units (see Eq. 11). We adopt the solar abundance measurements by Asplund et al. (2009); under this assumption, the solar iron abundance is Zm, ⊙ = 0.00124; this is the solar iron abundance by mass fraction with respect to the gas mass, namely (ρFe/ρgas)⊙. This is the value reported in our Sect. 5.1 and used throughout the paper. However, when we derived 𝒴Fe using the yIa, kIa, yCC, and kCC estimates from Maoz & Graur (2017), we erroneously used Zm, ⊙ = 0.00174, which is the solar iron abundance by mass fraction with respect to the hydrogen mass, (ρFe/ρH)⊙, leading to a wrong expected range for the iron yield. The correct estimate for 𝒴Fe is  .
.
In the meantime, Freundlich & Maoz (2021) published updated values for Type-Ia supernova (SNIa) rates. Their new estimates provide  , which leads to
  . By chance, the new updated value is not very different from the wrong value reported in Ghizzardi et al. (2021), leaving our discussion and main conclusions unchanged.
The last paragraph in Sect. 5.2 should be replaced with: “Recently, it has been shown (see Maoz & Graur 2017 and Friedmann & Maoz 2018) that type Ia SN explosions in galaxy clusters are more frequent than in the field. If, following Maoz & Graur (2017), we assume a SNIa rate per unit mass of  , we derive
  . More recently, Freundlich & Maoz (2021) published updated values for SNIa rates in clusters,
  , which lead to
  (gold shaded region in Fig. 19). This revised SN rate brings the expected effective yield closer, but it is still well below the measured ones.”
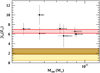 |
Fig. 19. Effective iron yield for the clusters of the sample. The red band is the 68% confidence interval around the mean. The yellow band shows the expected value computed through the SN yields derived from Maoz & Graur (2017) and Renzini & Andreon (2014; see text for details); the gold band represents the expected value derived assuming recent estimates for SNIa rates in galaxy clusters by Freundlich & Maoz (2021). |
Figure 19 should be replaced with the one reported here.
References
- Asplund, M., Grevesse, N., Sauval, A. J., & Scott, P. 2009, ARA&A, 47, 481 [NASA ADS] [CrossRef] [Google Scholar]
- Freundlich, J., & Maoz, D. 2021, MNRAS, 502, 5882 [Google Scholar]
- Friedmann, M., & Maoz, D. 2018, MNRAS, 479, 3563 [Google Scholar]
- Ghizzardi, S., Molendi, S., van der Burg, R., et al. 2021, A&A, 646, A92 [CrossRef] [EDP Sciences] [Google Scholar]
- Maoz, D., & Graur, O. 2017, ApJ, 848, 25 [Google Scholar]
- Renzini, A., & Andreon, S. 2014, MNRAS, 444, 3581 [NASA ADS] [CrossRef] [Google Scholar]
© ESO 2021
All Figures
|
Fig. 19. Effective iron yield for the clusters of the sample. The red band is the 68% confidence interval around the mean. The yellow band shows the expected value computed through the SN yields derived from Maoz & Graur (2017) and Renzini & Andreon (2014; see text for details); the gold band represents the expected value derived assuming recent estimates for SNIa rates in galaxy clusters by Freundlich & Maoz (2021). |
| In the text | |
Current usage metrics show cumulative count of Article Views (full-text article views including HTML views, PDF and ePub downloads, according to the available data) and Abstracts Views on Vision4Press platform.
Data correspond to usage on the plateform after 2015. The current usage metrics is available 48-96 hours after online publication and is updated daily on week days.
Initial download of the metrics may take a while.